When you insert charts in Excel, you’ll have them in the center of your worksheet. But, to reorder the charts, you may want to move them to the left part of your spreadsheet. Especially, if you are creating Dashboards to line up all of the charts together. In that case, you could Left align the chart.
Left Align an Excel Chart
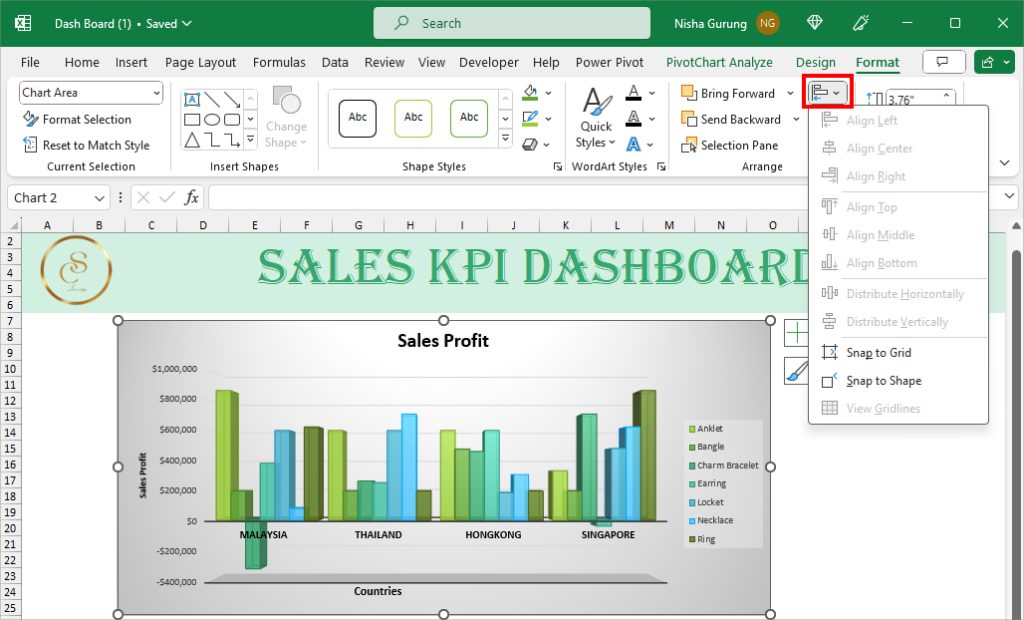
Unfortunately, if you select only a single chart and go to the Align menu, you’ll see that all of the Align options are greyed out. So, to left align an individual chart, you would have to use the usual drag-and-drop method.

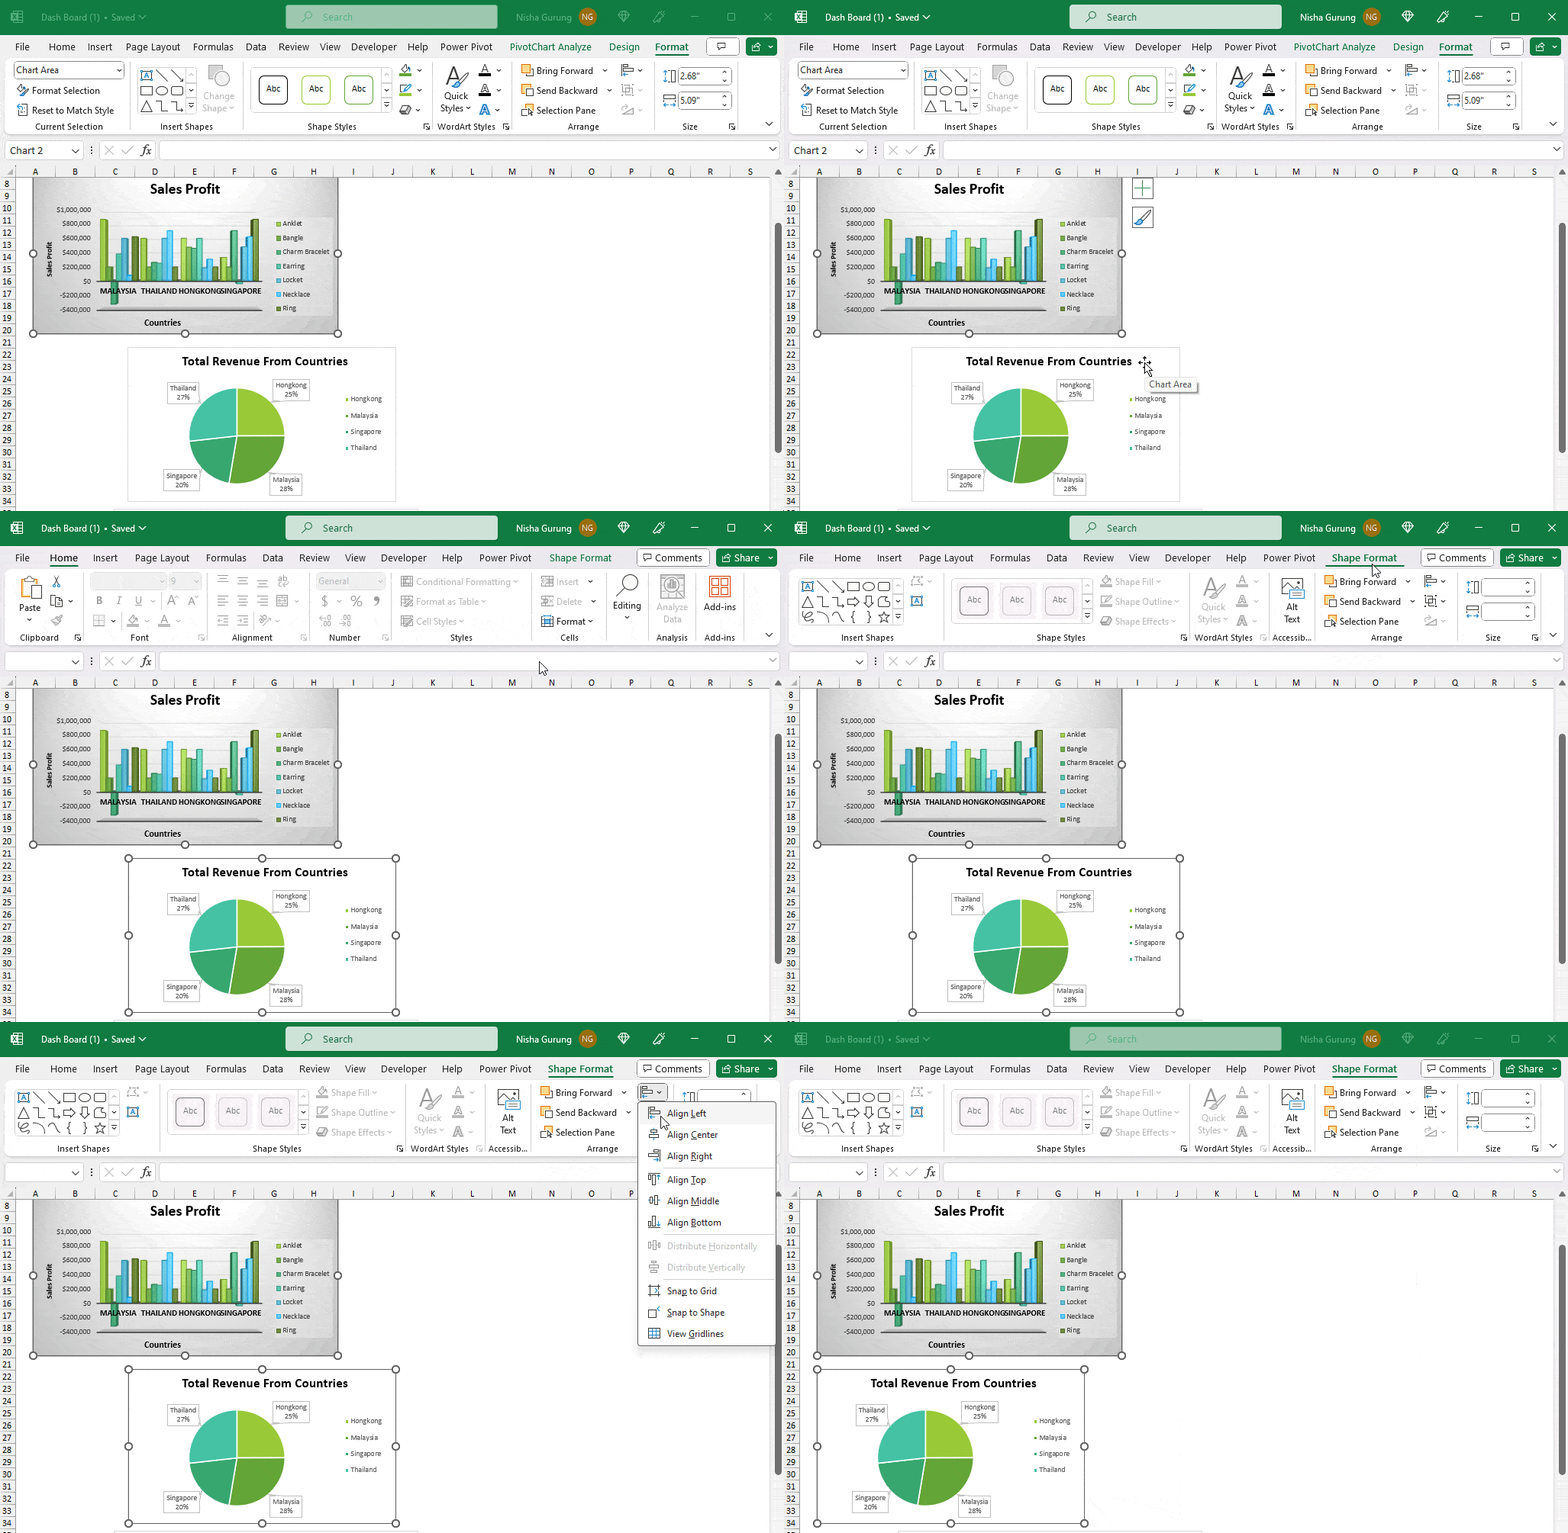
However, if you need to align multiple charts at once in Excel, here’s how to do it.
- Select the First chart.
- Hold down the Shift key and select Another Chart.
- Navigate to the Shape Format Tab. In the Arrange Section, click on Align > Align Left.

Left Align Y-Axis in Excel Chart
If you have a longer text in the Y-Axis of the Excel chart, the text alignment is in the center by default which can look very unorganized. Unlike charts, you cannot apply a Left Alignment or change the text direction to the left.
However, as a workaround, you could use other Microsoft Office programs like PowerPoint or Word to achieve this. As an example, I’ll be covering the steps to left align in the Word below.
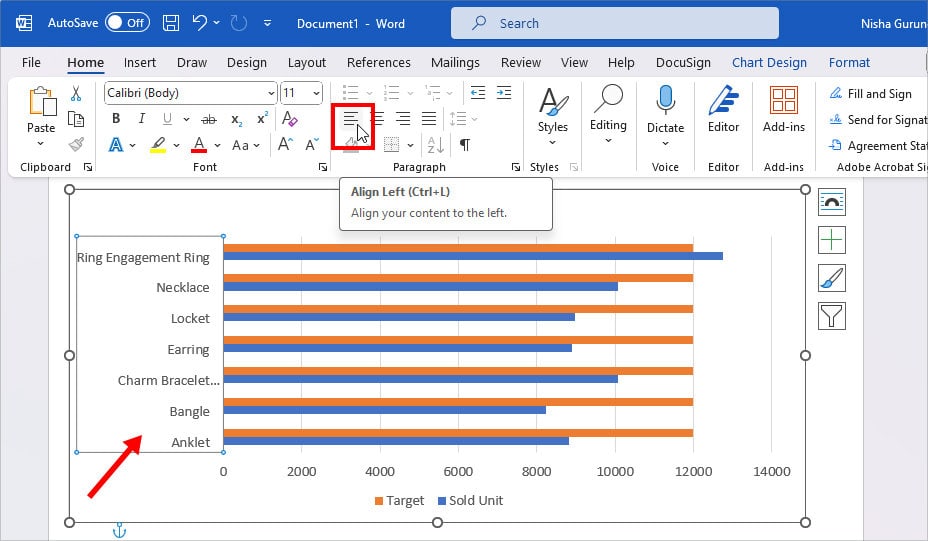
- Firstly, copy the Excel chart and paste it onto the Word document.
- Select the Y-axis label and head to the Home Tab. In the Paragraph section, click on the Left Align.

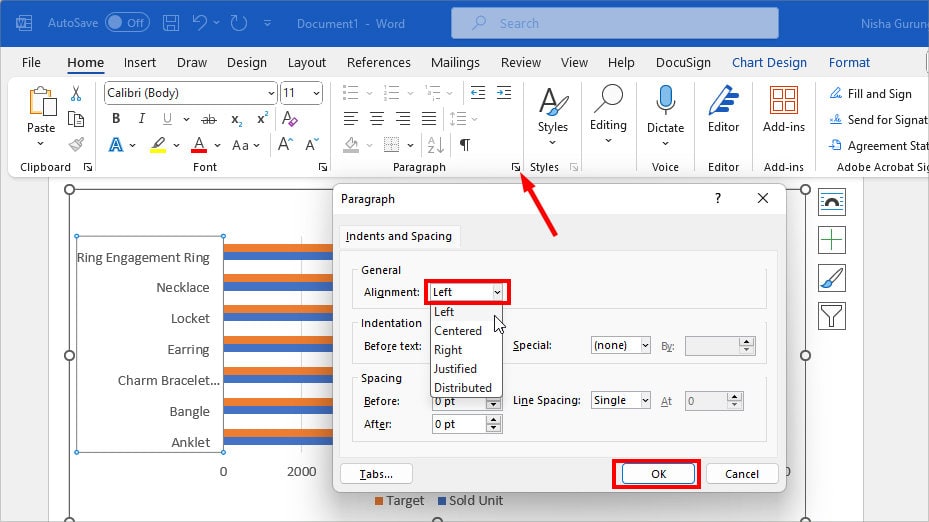
Alternatively, you can also, click on the Dialogue box launcher for the Paragraph. Below General, pick Left on the Alignment and click OK.
