Flowcharts are a visual representation of an algorithm or a process. When presenting a sequential process, flowcharts help visualize the actions.
Standard flowcharts contain different shapes for each type of data. You can find all flowchart shapes, from basic to complex from the Shapes tool in Excel. If you’re looking to show only a flow of process, you can also use Excel’s smart art.
What are the Shapes Used in a Flowchart?
Before we get into how we can insert flowchart shapes in Excel, let’s get into what each shape represents in a flowchart.
It is very important to know what each shape represents in a flowchart. This is because each shape holds a very different type of data.
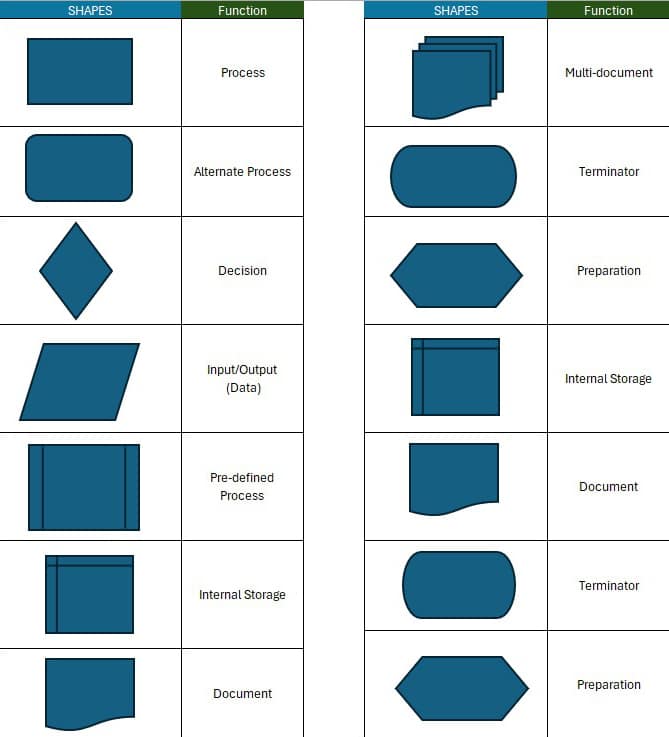
For example, you start and end your flowchart with an oval. Therefore, the oval is termed as the Terminator. Similarly, you enter your input and output values in a parallelogram and show the process, often calculations, in a rectangle. If your flowchart contains multiple scenarios, you can use the diamond shape as a decision box.
Remember, your flowchart must always be connected by flowlines, where each sequence must be pointed to with an arrow.
Here is a simple flowchart I created to calculate the total area of a rectangle and whether to buy more paint or not.
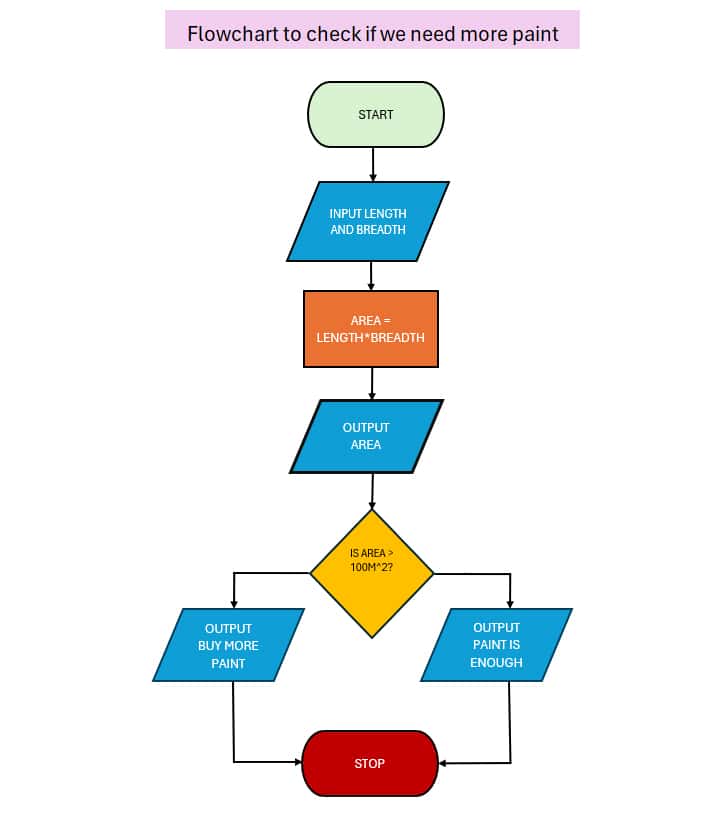
Here, the oval shape declares the start and end of the flowchart. Similarly, we used the parallelogram to input the length and breadth, processed the area in a rectangle, and then again used the parallelogram to display the total area.
Next, we used the diamond to check if the area was more or less than 100m^2. Based on the value, we prompted our flowchart to display two different results. Lastly, we connected both of the scenarios with the terminator.
How to Insert Flowcharts in Excel?
You can insert flowcharts in the form of shapes, and SmartArt. Additionally, you can even draw your flowcharts in Excel.
Insert Flowcharts as Shapes
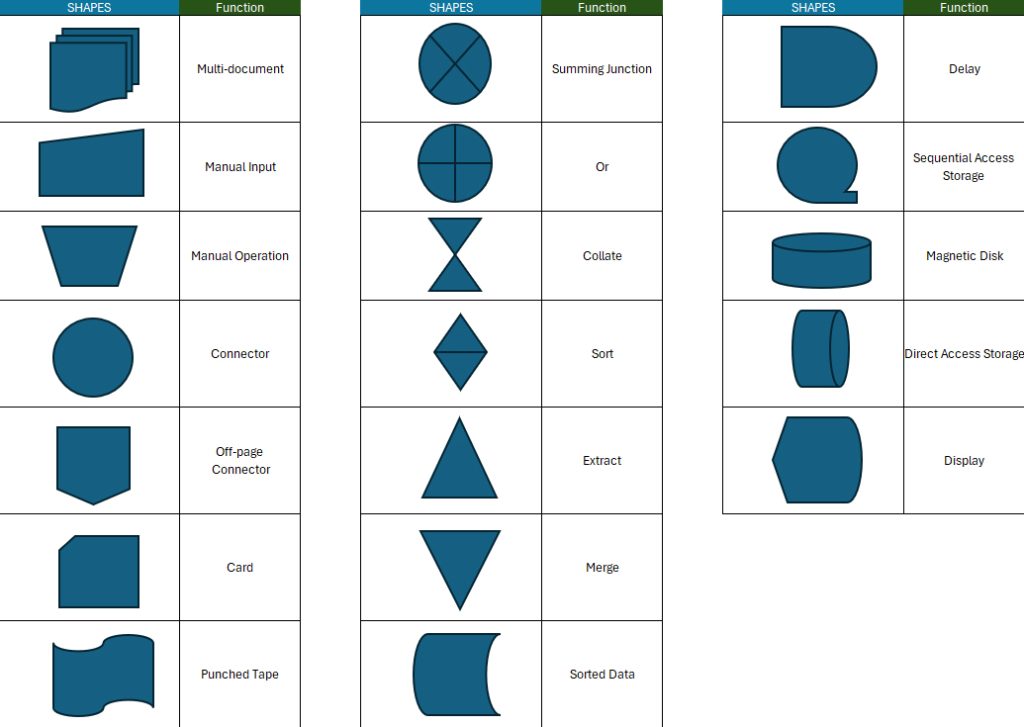
Excel has a separate section for flowchart shapes in the Shapes tool. Here are all the flowchart shapes Excel offers, with their functions.
To insert flowchart shapes in Excel, follow these steps:
- Go to the Insert tab.
- In the Illustrations section, click on Shapes.
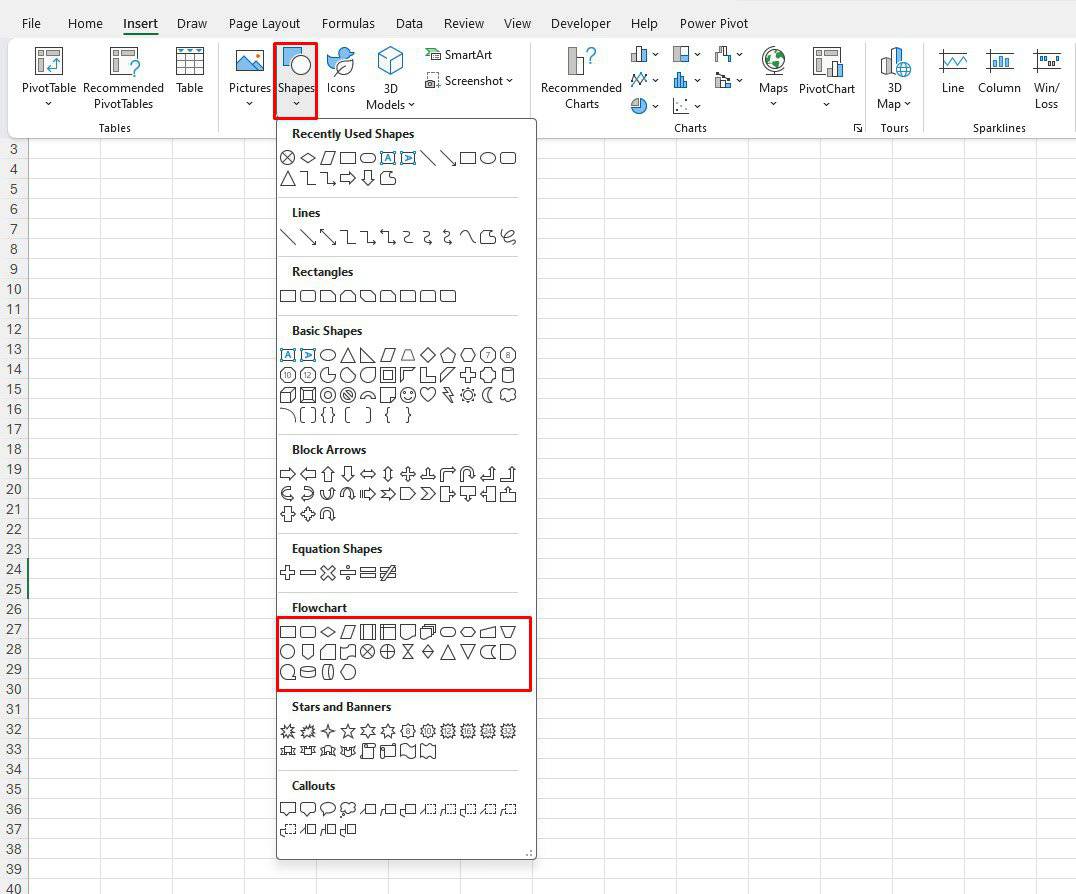
- Locate the shape you wish to insert in the Flowchart section and click on it.
- Drag your cursor on the spreadsheet to place your image. Once you’ve placed it, you can use the anchor points to adjust it.
Draw your Flowchart
Flowcharts only pictorize your workflow. Therefore, they are mostly created during the planning stage and are not entirely formal. If you’re comfortable drawing in your flowchart shapes, you can enable the Draw tab from the Excel options.
- Go to File > Options.
- From the sidebar, head to Customize Ribbon.
- Under Main Tabs, select Draw.
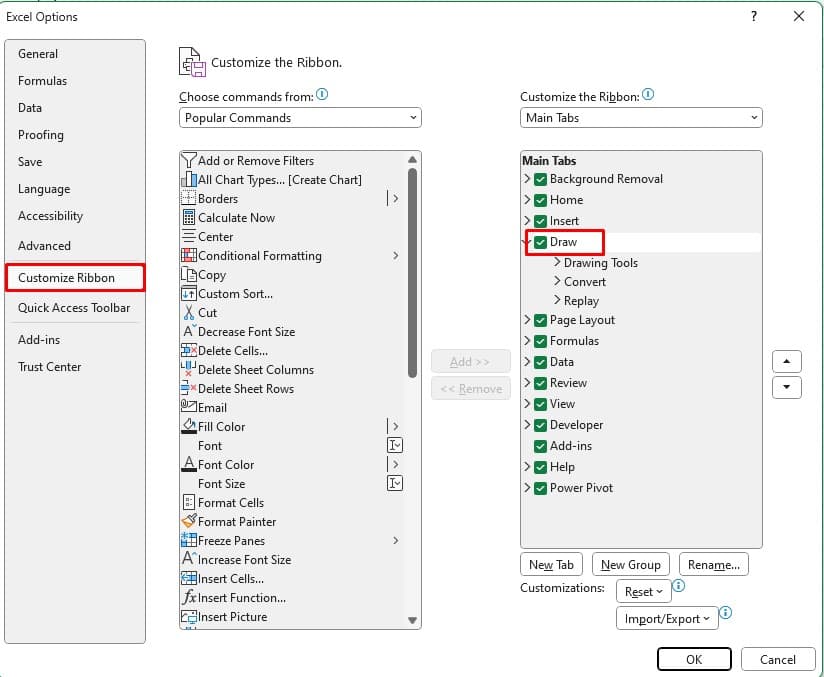
- Click OK.
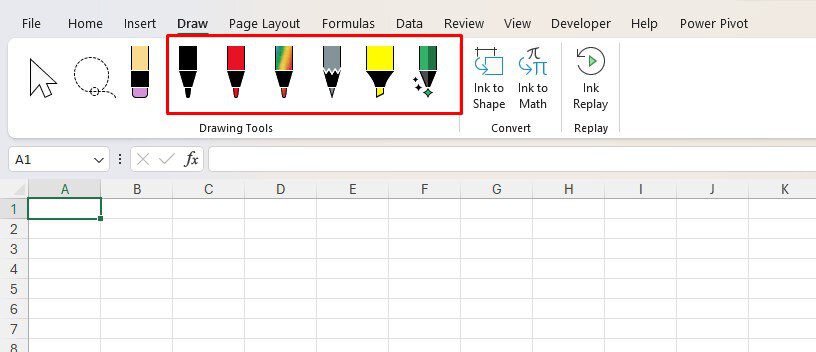
- To draw in your shapes, go to the Draw tab and select a brush.
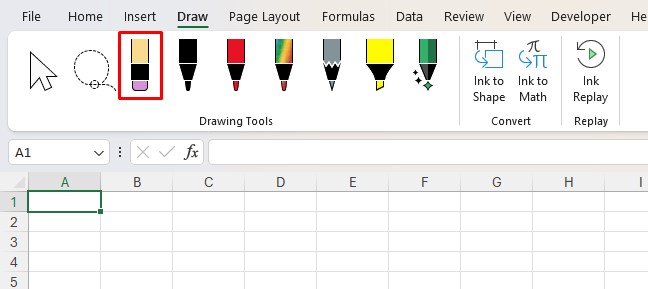
- You can correct your mistakes using the eraser tool.
Insert Flowcharts as SmartArt
If you’re looking to create a general progression, it is not absolutely necessary for you to insert a standard flowchart. You can visualize a sequence in Excel using the SmartArt tool.
The SmartArt tool contains a list of graphics including Process, Cycle, Pyramid, and so on. Specifically for flowcharts, it would be better if you choose to insert a SmartArt from the Process section.
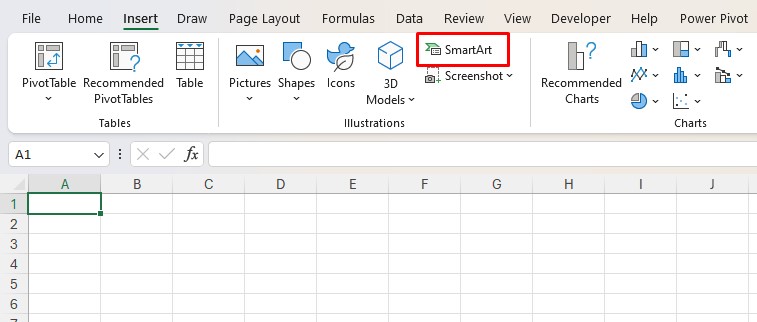
- Go to Insert.
- From the Illustrations section, select SmartArt.
- From the sidebar, choose Process.
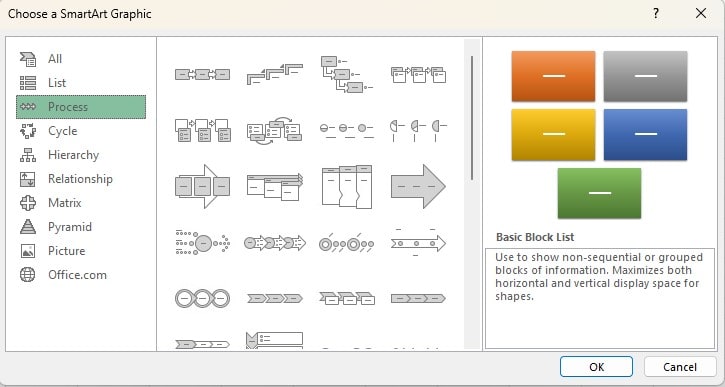
- Scroll down to check the types of illustrations.
- Once you find the one you like, click on it and select OK.
- Edit the text inside the SmartArt with your data.
Add Boxes in your Flowchart
When you’re inserting flowcharts as SmartArt, you may find yourself in constant need of adding more steps. You can add a step before, after, above or below your chart, depending on the type of chart you’re working on.
- Select your chart.
- Go to SmartArt Design.
- In the Create Graphic section, select the fly-out next to Add Shape.
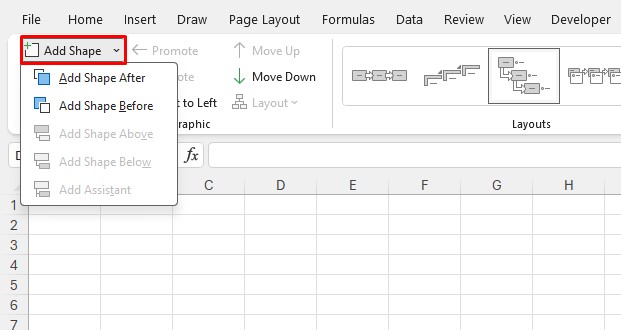
- Choose an option.
Change the Position of your Flowchart
Say you’re working on a flowchart when you realize you inserted a step ahead of its sequence. You don’t have to go back and edit your description. Instead, you can simply move down the shape. Similarly, you can also move the shapes up in your SmartArt.
- Select your SmartArt.
- From the Create Graphic section, select Move Down to place your object a step below.
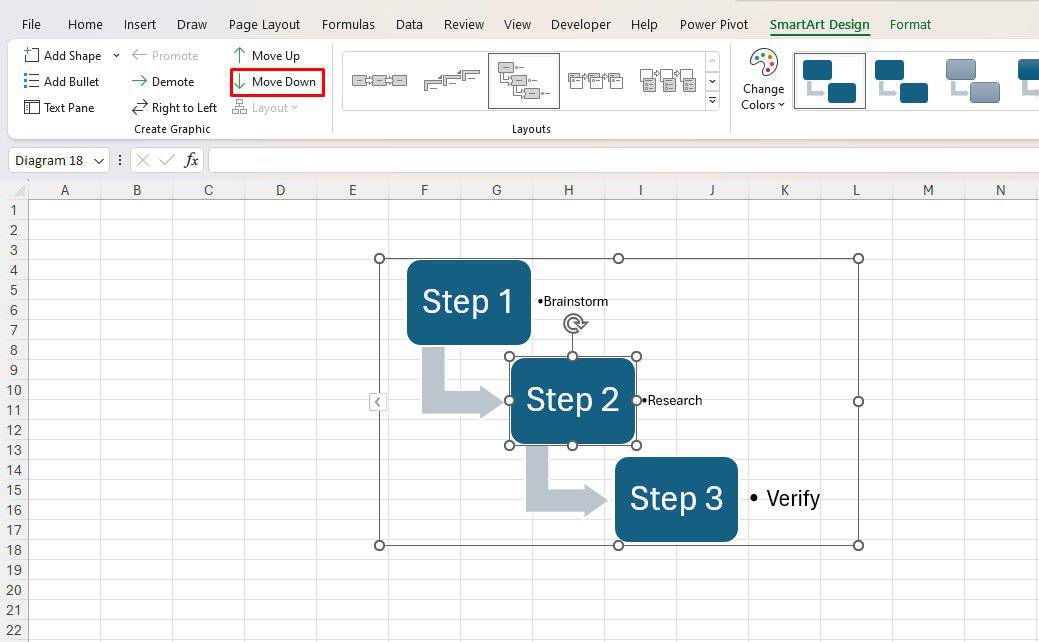
- To move your graphics up, select Move Up.
- If you wish to merge the current step into the previous step select Demote.
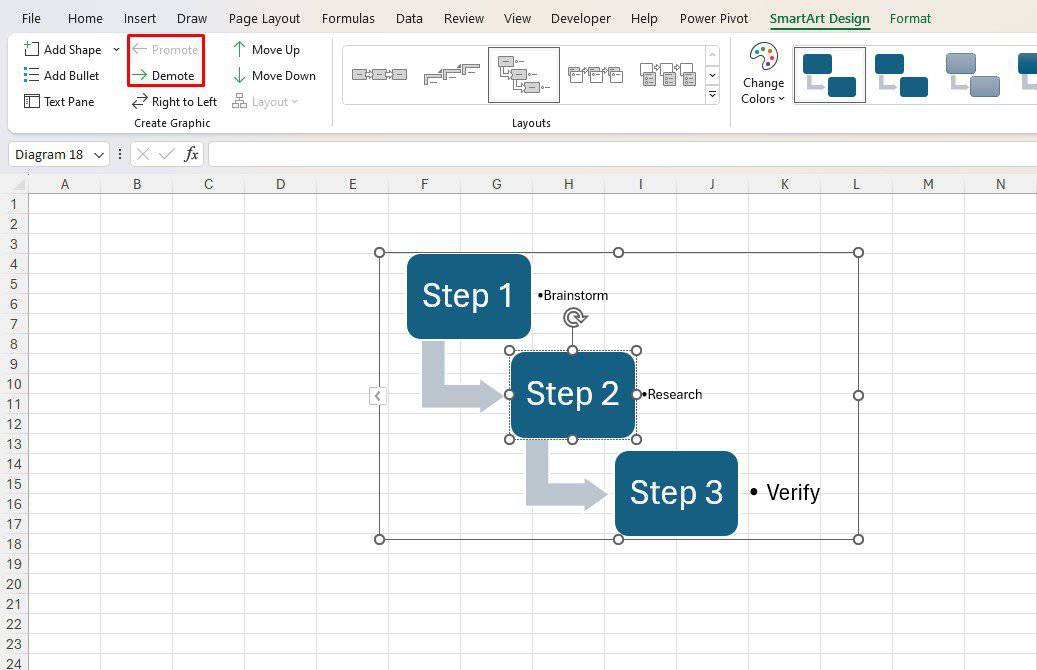
- To create a new step out of the current description, select Promote.
How to Format Flowchart Shapes?
Once you’ve inserted your flowchart, you can format the shapes with different colors, according to their data type. For instance, I like to format the first terminator as green to mark the beginning of the flowchart and the last terminator as red.
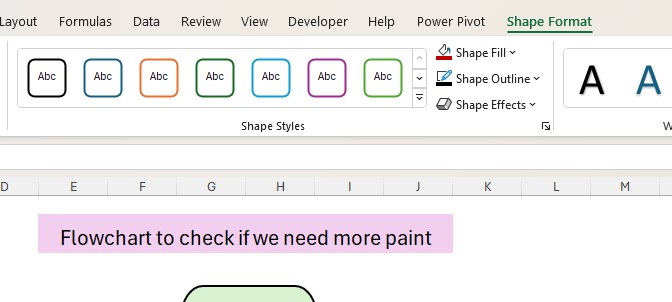
Format Shapes
- Select your shape.
- Go to Shape Format from the menubar.
- Format the shapes from the Shape Styles section.
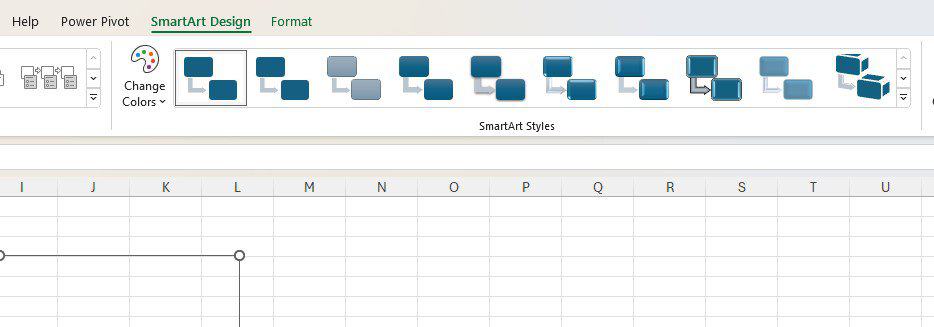
Format SmartArt
- Select the SmartArt.
- Head to the SmartArt Design tab.
- Change the color and blend of your SmartArt from the SmartArt Styles section.
- Go to the Format tab.
- Apply formatting to the illustration from the Shape Styles section.