For statisticians, Excel’s Descriptive Statistics tool is a secret sauce to quickly compute and analyze complex statistical data.
The Descriptive Statistics tool will generate the value of the Mean, Standard Error, Median, Mode, Standard Deviation, Sample Variance, Kurtosis, Skewness, Range, Minimum, Maximum, Sum, Count, etc for your sample all at once.
So, you wouldn’t have to manually calculate each of the measures one by one. Let’s learn everything about Descriptive Statistics to use it in your favor.
What is Descriptive Statistics?
Descriptive Statistics is basically the summary report of an entire dataset after measuring the three major factors such as Central Tendency, Variability, and Frequency Distribution.
Here, the Central Tendency refers to the Mean, Median, and Mode. Variability describes Variance and Standard Deviation.
Similarly, Frequency Distribution reports the total occurrence of value from the sample.
So, what do you use the Descriptive Statistics for?
Let’s take a very simple example of Descriptive Statistics. To evaluate the overall Student’s GPA and performance of a student, you calculate the mark sheets from various exams and grades.
Then, find out the aggregate value at the end and conclude the academic result, isn’t it?
Overall, the report summarizes the complex and incomprehensible quantitative data into meaningful output that can be used for data analysis.
In Excel, there’s an in-built Descriptive Statistics tool in the Analysis ToolPak Add-In to create a report. All you need is a sample data set for it.
How to Use Descriptive Statistics?
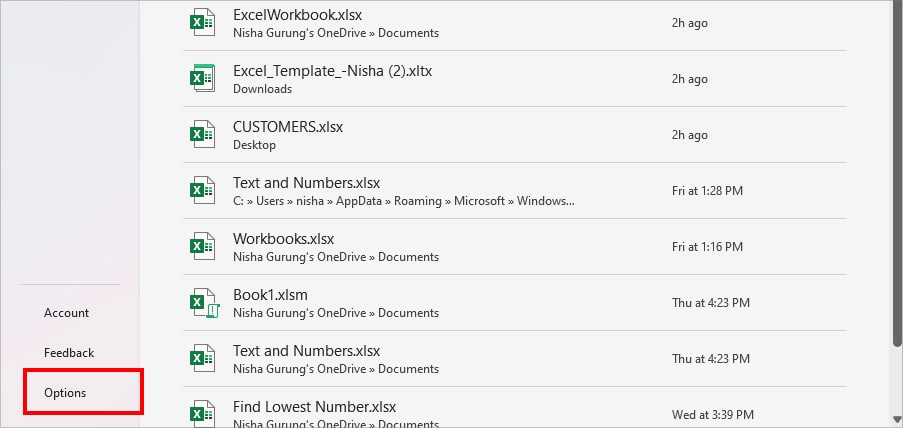
To use Descriptive Statistics, you must load the Analysis ToolPak Add-In to your Excel first. Then, you can create a report with that tool.
Step 1: Add Analysis ToolPak Add-In
- Launch Excel. Then, click Options.
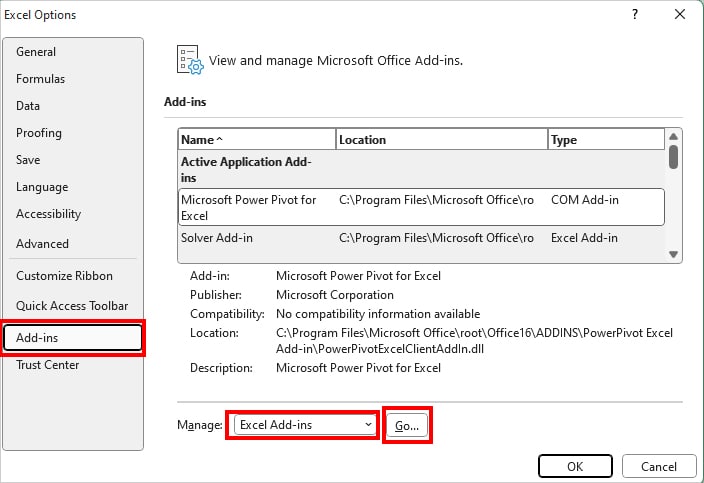
- Head to the Add-ins category. On Manage, make sure Excel Add-ins is selected and hit Go.
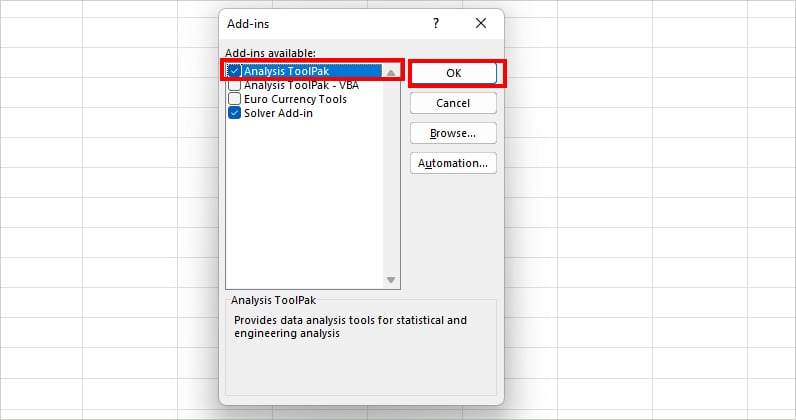
- On the Add-ins dialogue box, check mark Analysis ToolPak and click OK.
Step 2: Create a Descriptive Statistics Summary
In the Descriptive Statistics dialogue box, you can see a lot of measure options. For Instance, Confidence Interval, Kth Largest, Summary Statistics, etc. But, you can choose to find only the ones you want to find.
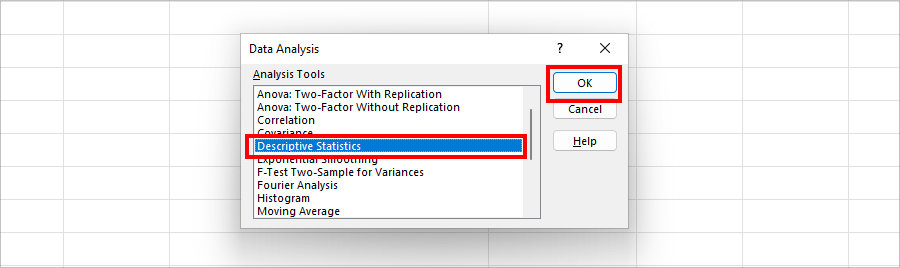
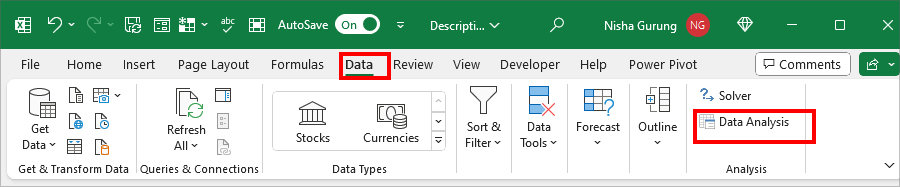
- On your worksheet, navigate to the Data Tab.
- From the Analysis section, click on Data Analysis.

- Select Descriptive Statistics and hit OK.
- On the Descriptive Statistics, enter the following information.
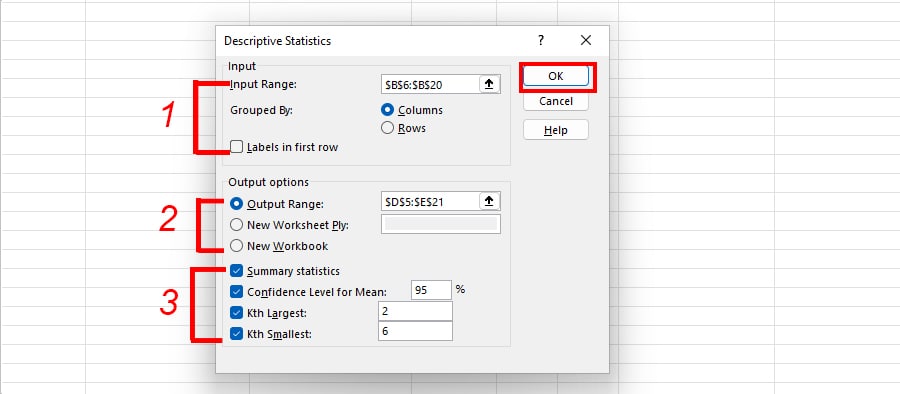
- Input Options: Define your Input Variable.
- Input Range: Select the cell ranges with Sample Data that you’re looking to analyze.
- Grouped By: Pick either Columns or Rows to arrange the variables in.
- Labels in First Row: Tick this option if your data has a heading.
- Output Options: Choose where you want to load the output.
- Output Range: Select an area of your same sheet.
- New Worksheet Ply: Load the results in a new worksheet.
- New Workbook: Check this option if you want the results to be in New Workbook.
- Descriptive Statistics: Specify what you want to incorporate in the summary.
- Summary statistics: Tick this option to find the overall Descriptive Statistics like Mean, Standard Error, Medium, Mode, Standard Deviation, and many more.
- Confidence Level for Mean: Know the Confidence Interval for Mean.
- Kth Largest: Select the box to determine the kth highest number from the data. Enter number to specify like 2nd highest, 5th highest, etc.
- Kth Smallest: Find the kth lowest number from the data. Check the box and input the number to determine the kth value. For example, 2nd smallest, 6th smallest, etc.
- Input Options: Define your Input Variable.
- Click OK.
Step 3: Interpret Descriptive Statistics
After preparing the Descriptive Statistics report, here’s how you can interpret the results.
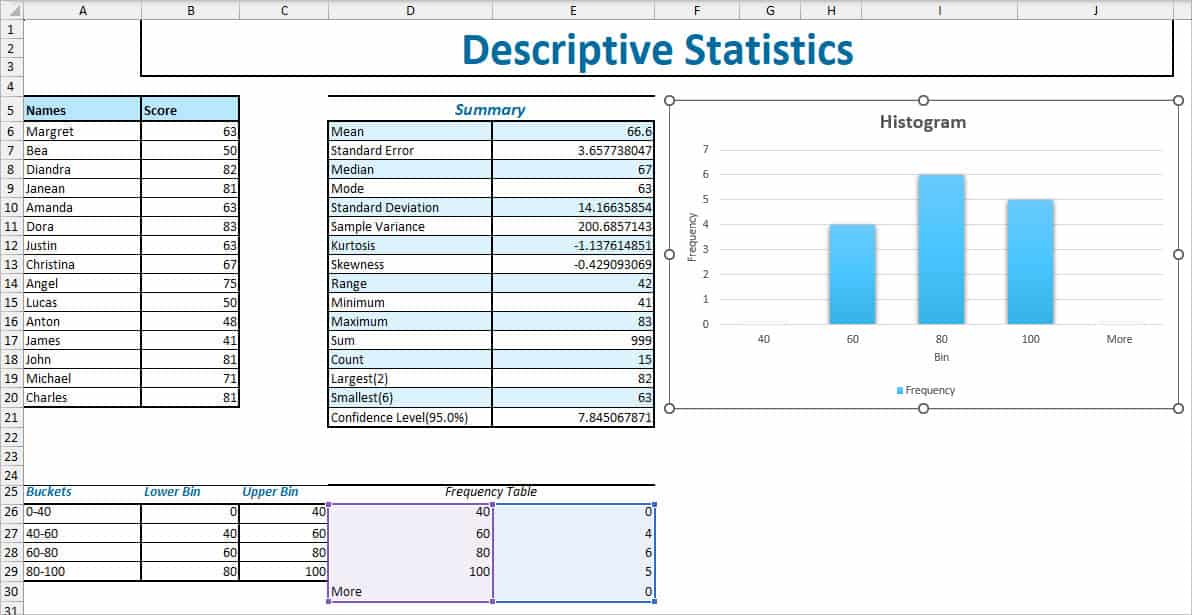
As an example, I will interpret the same Summary report we generated above which is the score of Students.
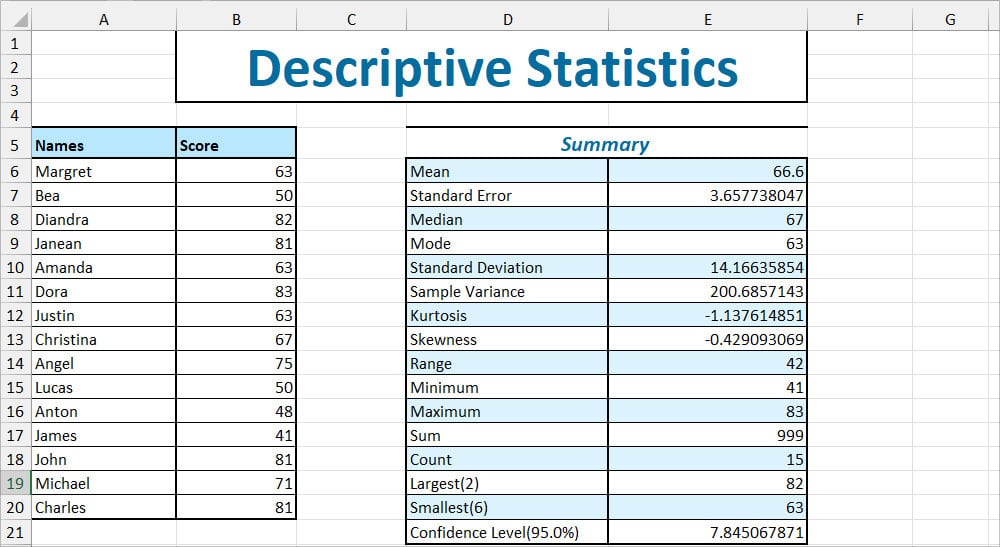
| Measure | Interpretation | Output |
| Mean (Average) | Average score from the given values. | 66.6 |
| Standard Error | The sample’s mean is at a 3.657 score distance in comparison to the population mean. The lower the SE, the more correct your population is. But, note that it depends on your sample size too. | 3.657738047 |
| Median | Midpoint score | 67 |
| Mode | Score that is frequently repeated in the given data set. In case there are no duplicate or common values, it’ll return #N/A. | 63 |
| Standard Deviation | The estimated distance of Scores from each mean. | 14.16635854 |
| Sample Variance | The variability of the Sample is 200.6857143. It is also the square root of Standard Deviation. | 200.6857143 |
| Kurtosis | Since the value is less than 0 and negative, it implies that the sample is Light-tailed with a flattened shape. This type of distribution is also known as Platykurtic kurtosis. | -1.137614851 |
| Skewness | The dataset distribution is negatively skewed. It implies that most of the values fall on the right part of the mean. | -0.429093069 |
| Range | Calculates the difference between maximum and minimum Scores which is (83 – 41) | 42 |
| Minimum | Lowest Score | 41 |
| Maximum | Highest Score | 83 |
| Sum | Grand Total of all Scores | 999 |
| Count | Total Number of Variables in the Input Range (Number of Scores) | 15 |
| Largest | 2nd largest score | 82 |
| Smallest | 6th smallest score | 63 |
| Confidence Level(95%) | There’s only one value in Confidence Level. But, we can use it to calculate the Upper Confidence Level and Lower Confidence Level. Upper CI= (Mean + 7.845067871) Lower CI= (Mean – 7.845067871) After finding out the values, it suggests that I can be 95% confident that my mean falls between 74.74.44506787 and 58.75493213. | 7.845067871 |
Step 4: Calculate Frequency and Add Histogram
After you’ve generated and Interpreted the Descriptive Statistics Summary, let us now create the Frequency Table.
By calculating Frequency, you can measure how many values fall in the specified ranges. Here, we will also add a Histogram chart to visually represent our distribution.
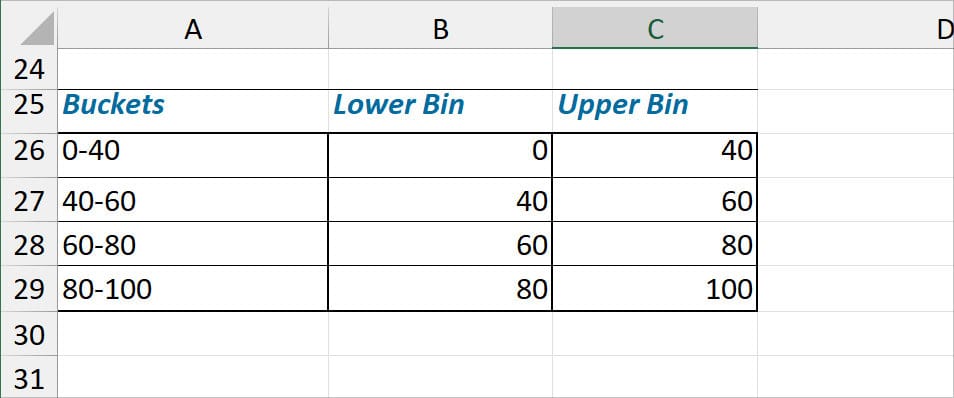
Before you begin, firstly, create Buckets and Bins for the Frequency Table as shown in the picture.
Now, follow the given steps.
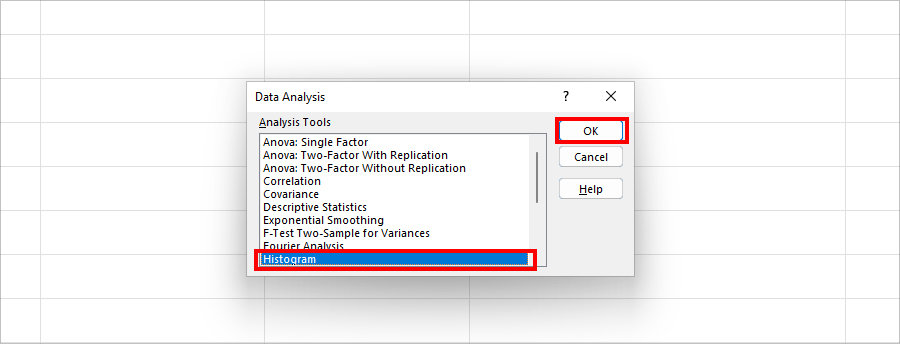
- From the Data Tab, click Data Analysis.
- Choose Histogram and click OK.
- On Histogram Box, do the following:
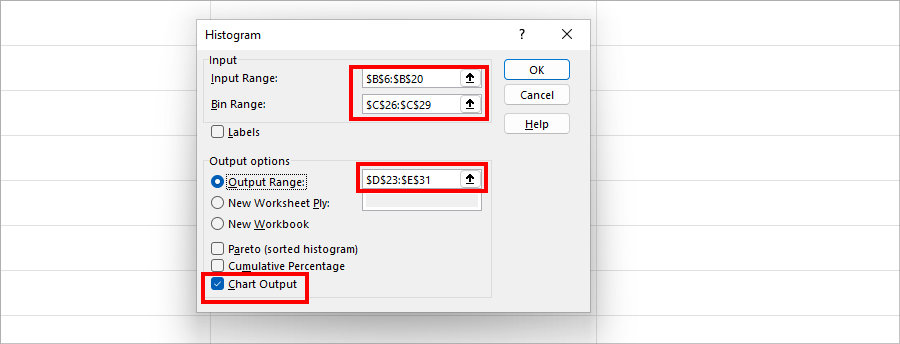
- Input Range: Select the Scores. Here, my Input Range is $B$6:$B$20.
- Bin Range: Select the Upper Bin Ranges.
- Output options: Pick Output Range. Then, select an area of your sheet with the Collapse icon.
- Finally, tick the option for Chart Ouput and click OK.
- You’ll have the Frequency and Histogram chart on your sheet. For Charts, head to the Chart Design Tab and apply any one from the Chart Styles.