If you’ve created Charts in Excel, you may find yourself constantly moving the charts here and there to reposition them. You could use the as-usual drag-and-drop method to relocate the chart within your current sheet.
However, to move the chart to a new sheet, Excel has an in-built Move Chart menu in the Chart Design Tab. You can use this menu to shift only one chart at a time. Besides, you could opt for the Visual Basics tool if you want to transfer multiple charts to the new sheet at once.
Method 1: Using Move Chart Menu
Firstly, you can use the default Move Chart menu to shift the chart. Here, you can choose to move charts to an existing sheet as Chart Object or to a new sheet as a Chart Sheet.
Before you begin with the steps, you need to be clear about how you want to move your charts. In this approach, most users tend to misperceive the menu and pick a different option instead.
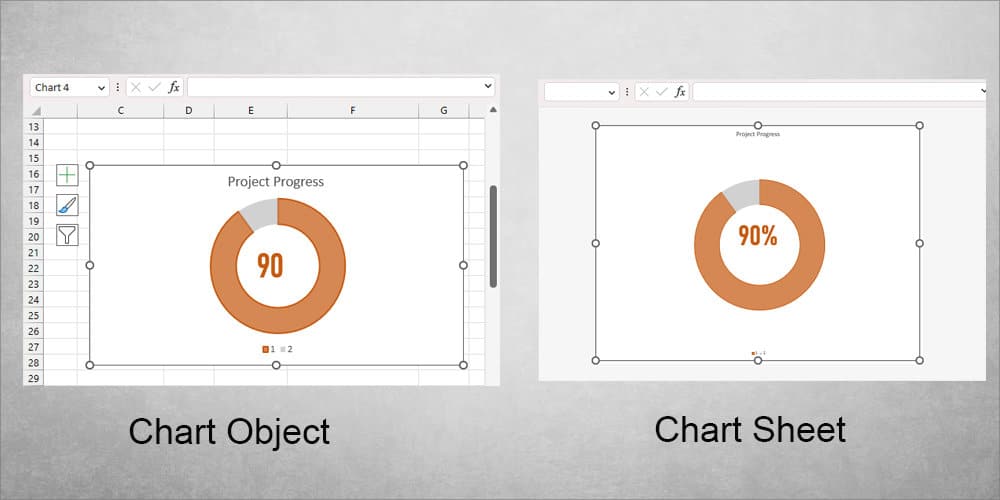
Basically, if you choose Chart Object, Excel will simply transfer the chart to the existing sheet you pick in your workbook. You can move chart positions anywhere as you used to do in the previous sheets.
On the other hand, on Chart Sheets, you cannot change your chart positions. When Excel creates an entirely new sheet for a single chart, it is called Chart Sheet. Here, you won’t find any cell grids or add any data as you can see in the above picture. You can format only the Chart Design.
Now, to Move Charts, follow the given steps.
- Click on the Chart area to select Chart.
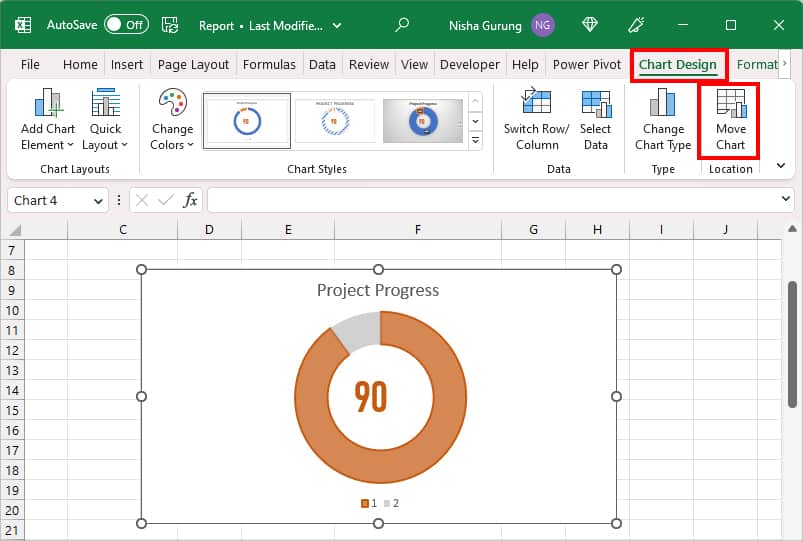
- Head to Chart Design. On the Location section, click Move Chart.
- On Move Chart window, pick any one of the location options to transfer the chart.
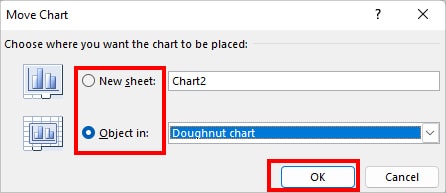
- New sheet: If you select this option, Excel will add a new sheet. Here, you just need to rename the chart title.
- Object in: If you pick this option, you will have existing sheet options to choose from. Expand the drop-down menu and choose the preferred Sheet to move your chart to.
- Click OK.
Method 2: Using Copy and Paste Command
When you move charts with the above method, you won’t have them in the original sheet anymore. Say you need to change the data value of the Chart. Although the data will automatically update in the chart, you’d still have to keep going back and forth between the sheets to verify.
So, to have the charts in both sheets, you could copy charts instead of moving them. For this, we will use the Copy and Paste command.
On the contrary, this method is also useful if you want to have the chart in picture format.
To do so, select the chart and press Ctrl + C to copy it. On a different sheet, right-click on any cell grid. Under Paste Options, pick any one of the Paste formats.
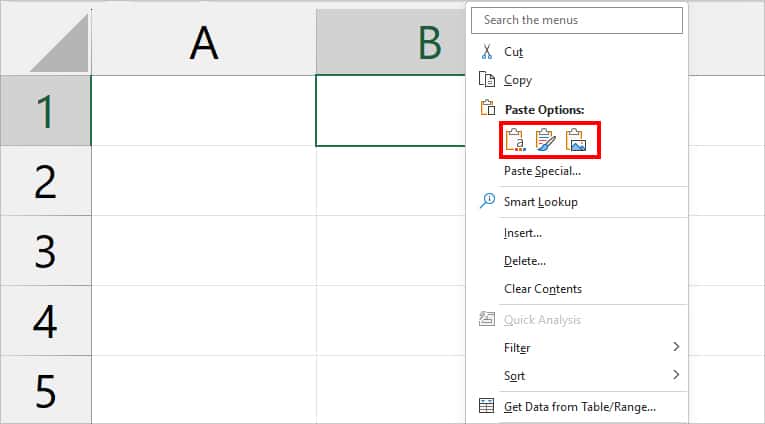
- Use Destination Theme: Format and paste the chart to match the theme of your destination sheet.
- Keep source formatting: Pastes the Chart in the same original format.
- Picture: Paste Chart in Picture format.
Method 3: Using the VBA Tool
We learned the steps to move the charts one by one in the given two methods. But, if you have to shift multiple charts, it can be very time-consuming and monotonous using these approaches. So, to move all the charts into a sheet at once, we will use Excel’s VBA (Visual Basics for Applications) tool.
If you’re new to Visual Basics, it is most likely you haven’t added Developer Tab to your workbook. Since Excel hides this tab by default, you have to manually insert them. For this, you can check out our other article to add as well as know everything about the Developer tab.
- Firstly, launch a workbook.
- Create a New sheet and Rename it. We named them Charts.
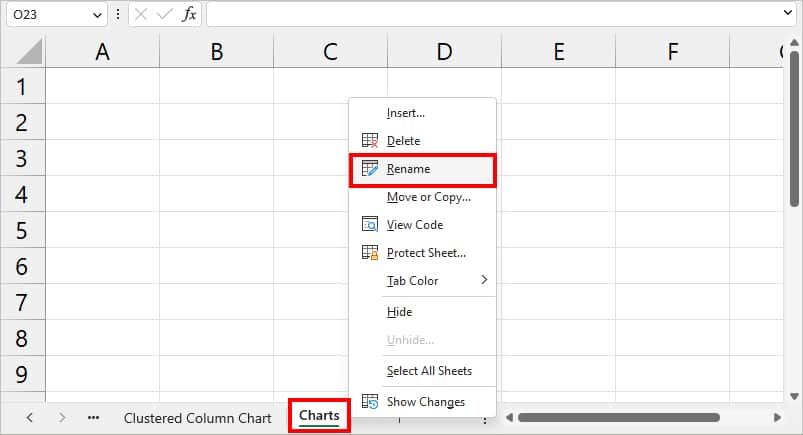
- Go to Developer Tab. On Code section, click Visual Basic.

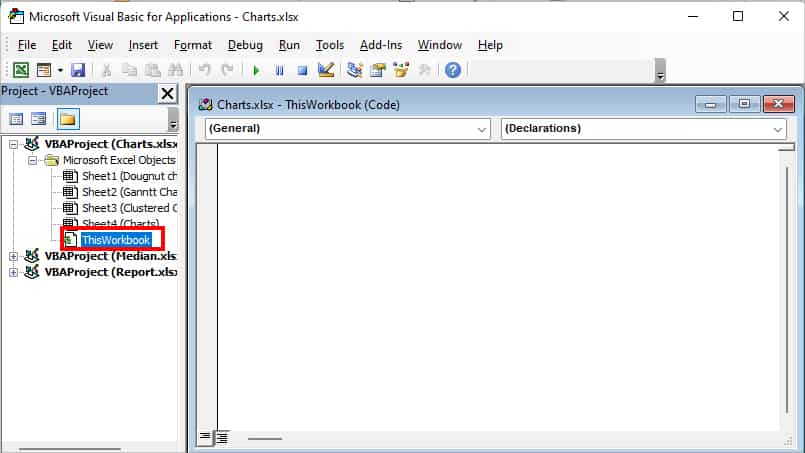
- On Microsoft Visual Basic for Applications window, click ThisWorkbook two times.
- Now, paste this code. Make sure you enter your new sheet name in “Your Sheet Name” like in the image.
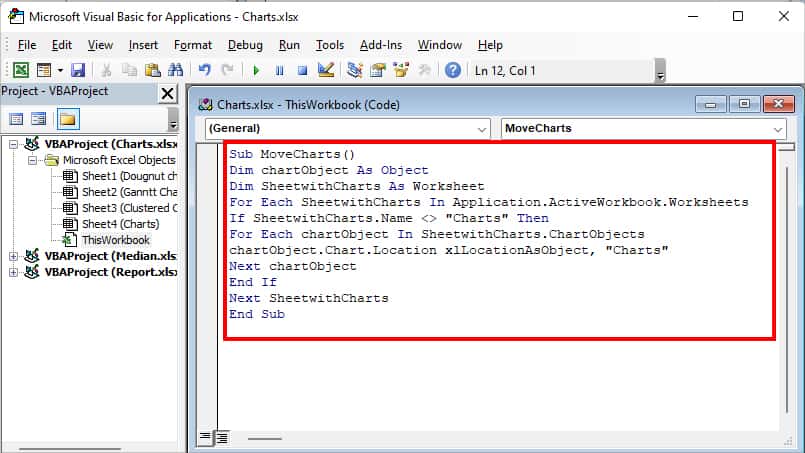
Sub MoveCharts()
Dim chartObject As Object
Dim SheetwithCharts As Worksheet
For Each SheetwithCharts In Application.ActiveWorkbook.Worksheets
If SheetwithCharts.Name <> "Your Sheet Name" Then
For Each chartObject In SheetwithCharts.ChartObjects
chartObject.Chart.Location xlLocationAsObject, "Your Sheet Name"
Next chartObject
End If
Next SheetwithCharts
End Sub
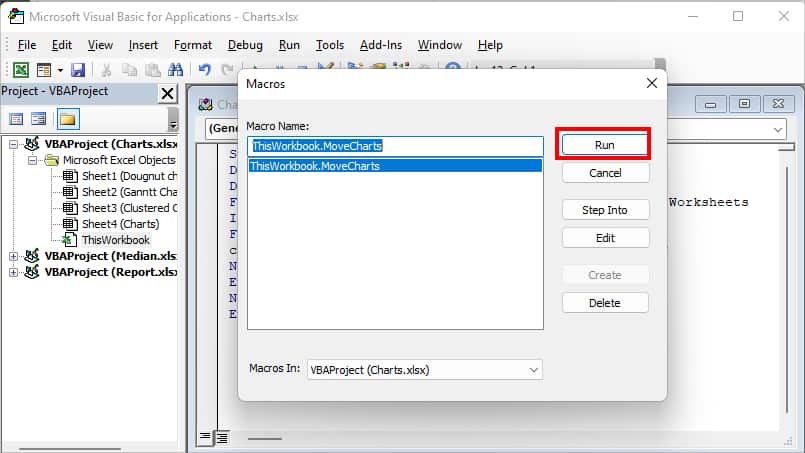
- Press F5 on your keyboard to run the code. Again, pick Run if prompted.
