Excel has a lot of powerful statistical functions like Median, Mean, Mode, Standard Deviation, and many more. However, since there is no built-in Standard Error function at the moment, it can leave your head scratching…
But, did you know that there’s a default Descriptive Statistics feature in Excel to calculate Standard Error?
Standard Error – Overview
If you’re already familiar with the Standard error, you can directly move on with the steps. But, since most users tend to confuse the Standard Error with Standard Deviation, we will quickly explore it in more detail first.
One thing you should note is that the value of the Standard Error is always lesser than the Standard Deviation.
Standard Error or Standard error of the mean (SEM) is used to measure the variability of the sample’s mean in comparison to the population mean. Mostly, the researchers calculate this value to create Confidence Intervals. So, how do you know if the Standard error is “Good” or “Bad?”
Well, it’s quite debatable because factors like samples, contexts, the population mean, etc. influence it. However, in general, a sample with a small standard error is considered to be more accurate and trustable.
If your sample has a minor standard error, it implies that your sample means are regular and approximate to the population mean. On the contrary, if you have a greater standard error, there’s more variation in your sample means.
How to Calculate Standard Error in Excel
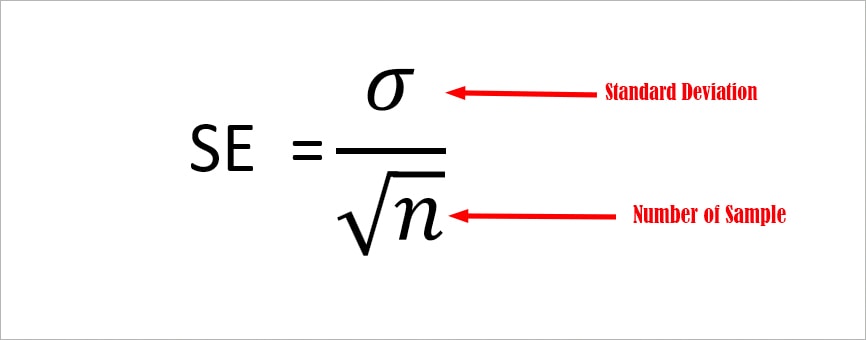
In mathematics, Standard Error is calculated with the given formula.
But, not in Excel! You can find smarter ways to find Standard Errors. You could simply use the formula or the Data Analysis tool.
Using Formula
Firstly, the easiest way to find the standard error is by using the formula. Here, we will create a custom formula using the STDEV.S, SQRT, and COUNT functions. Before we dive into the example, you could take a look at the function syntax first.
| Function | Syntax | Description |
| STDEV.S | =STDEV.S(number 1, number 2) | The function returns the standard deviation from the sample data. |
| SQRT | =SQRT(number) | Returns a square root in a positive number. |
| COUNT | =COUNT(value1, [value2]) | Counts the cells with value. |
Example: Suppose, I have a list of Sample data in Column B2:B13. To calculate the Standard Error I used the formula as.
=STDEV.S(B2:B13/SQRT(COUNT(B2:B13)))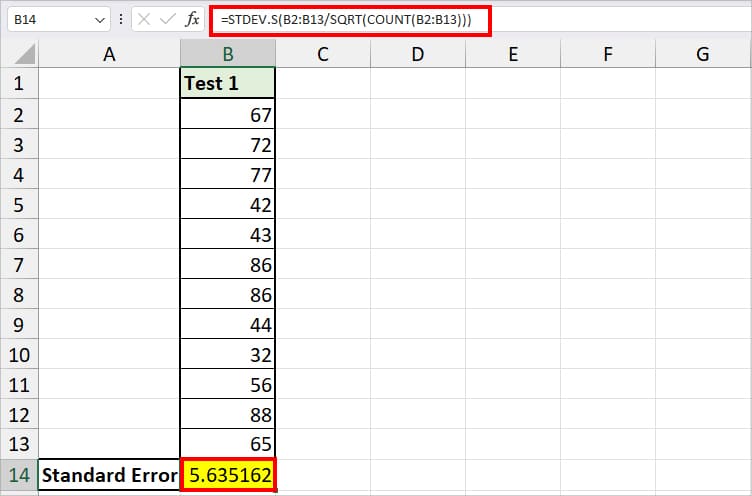
The formula returned 5.6351612 as a result. Let’s check out how we got this result.
- COUNT(B2:B13): First, the COUNT function counts the numbers and returns the cells with numbers. It returned 12.
- SQRT(COUNT(B2:B13)): The SQRT function returns the square root of 12 which is 3.464101
- STDEV.S(B2:B13/SQRT(COUNT(B2:B13))): Finally, the STDEV.S calculates the standard deviation by dividing the B2:13 and 3.464101.
Using Data Analysis ToolPak
In the above method, we only calculated the Standard error for the given sample. But, if you want a detailed analysis of the Sample such as Median, Mode, Sample Variance, Skewness, and Standard Deviation values, use this method. Here, we will be using Excel’s Data Analysis ToolPak to calculate the descriptive statistics.
Step 1: Add ToolPak Add-In
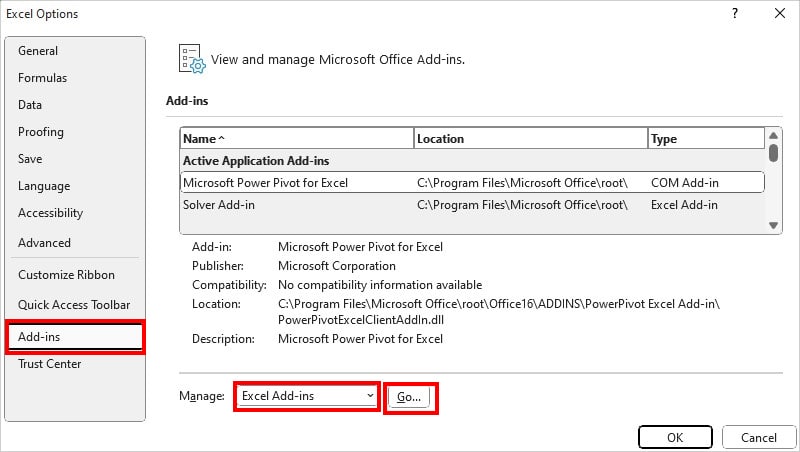
- On Excel, head to File Tab > Options.

- Go to the Add-ins category. Ensure the Manage menu is set to Excel Add-ins and hit Go.
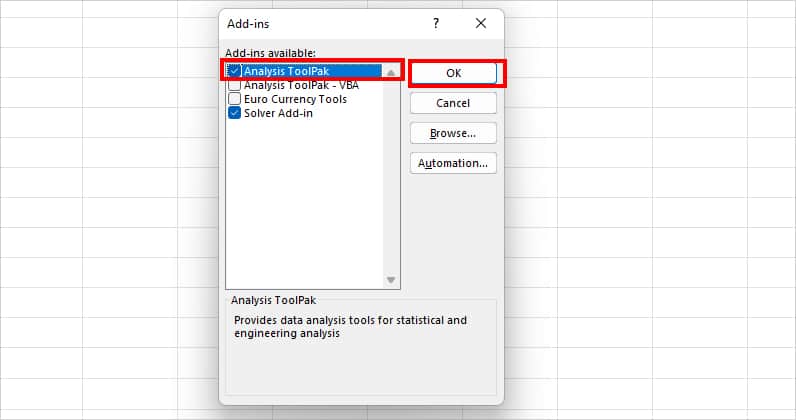
- On Add-ins, check the box for Analysis ToolPak and click OK.
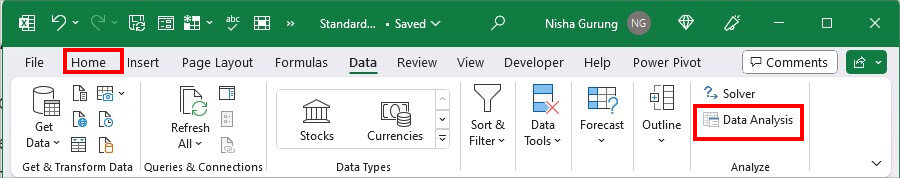
- You’ll see the Data Analysis in the Analyze group of the Home Tab.
Step 2: Find Out the Standard Error
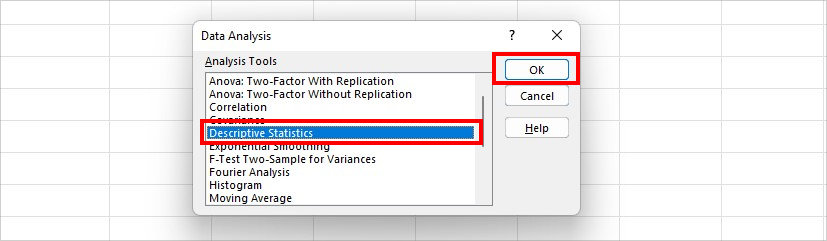
- Click on the Data Analysis.
- On the Data Analysis window, click on Descriptive Statistics and hit OK.
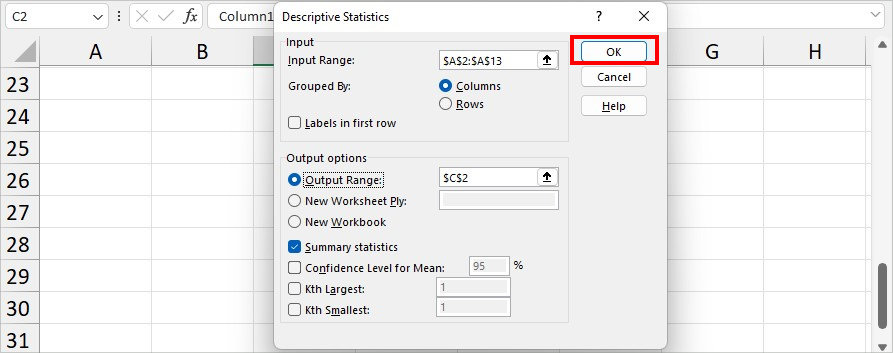
- On Descriptive Statistics, fill in the following fields:
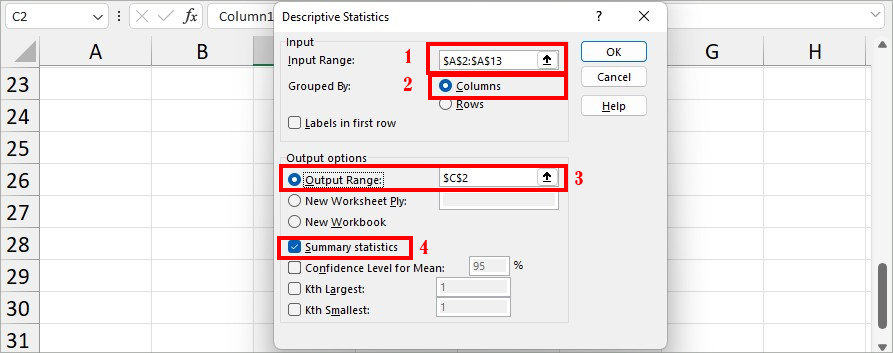
- Input Range: Click on the Collapse icon and select the sample range.
- Labels in First Row: Tick this option if you select the column header in the Input Range.
- Output Range: Below the Output option, choose Output Range and select a cell range to return the output.
- Summary Statistics: Tick the option
- Click OK.
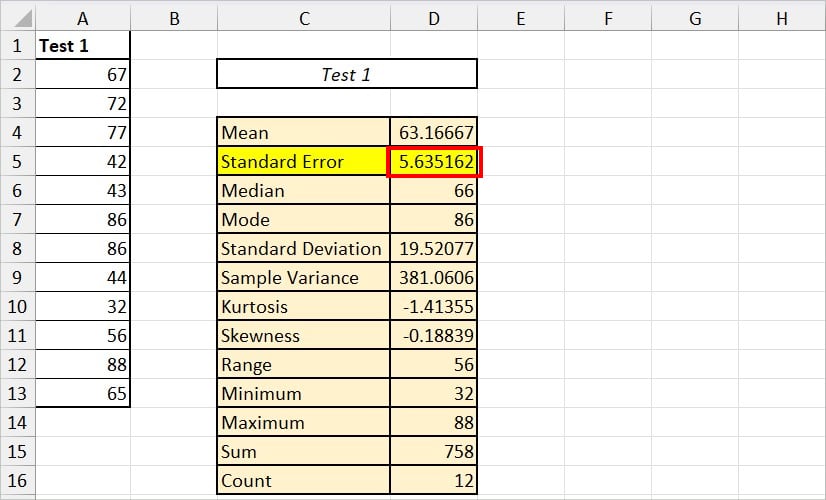
- You can see the Standard Error Value just below the Mean.
How to Insert Standard Error Bars?
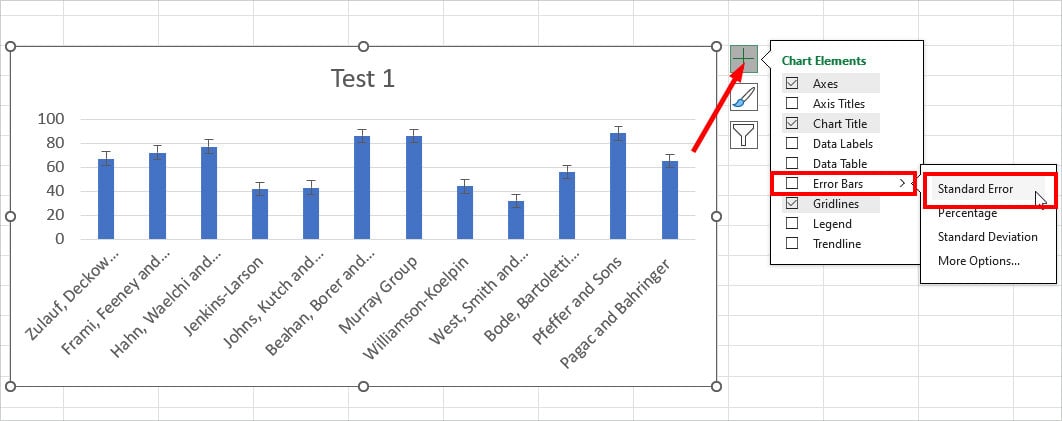
After you find out the Standard Error, you could also insert the charts for graphical representation. To illustrate this, you can add the error bars to the chart.
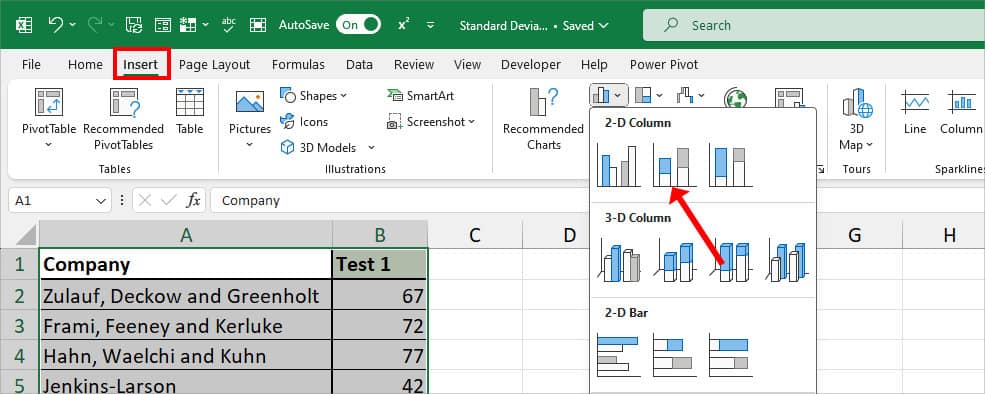
- Select your data and head to the Insert Tab.
- From the Charts section, pick any one 2-D Column Chart.
- Select the chart and click the + icon. Below, Chart Elements, hover over Error Bars > Standard Error.