You will find numerous instances to calculate the Z score of a data point if you frequently use Excel for statistics. Z score in simple terms is a measure of how close a data point is from the mean in terms of standard deviation.
If your Z score is negative, it translates to your data being less than the mean. Similarly, a positive Z score identifies that the data point is larger than the mean.
Unfortunately, as for now, there isn’t a function in Excel that will calculate the Z score of your data. You will have to first calculate the mean and the standard deviation of your data range to calculate the Z score.
How to Calculate Z score?
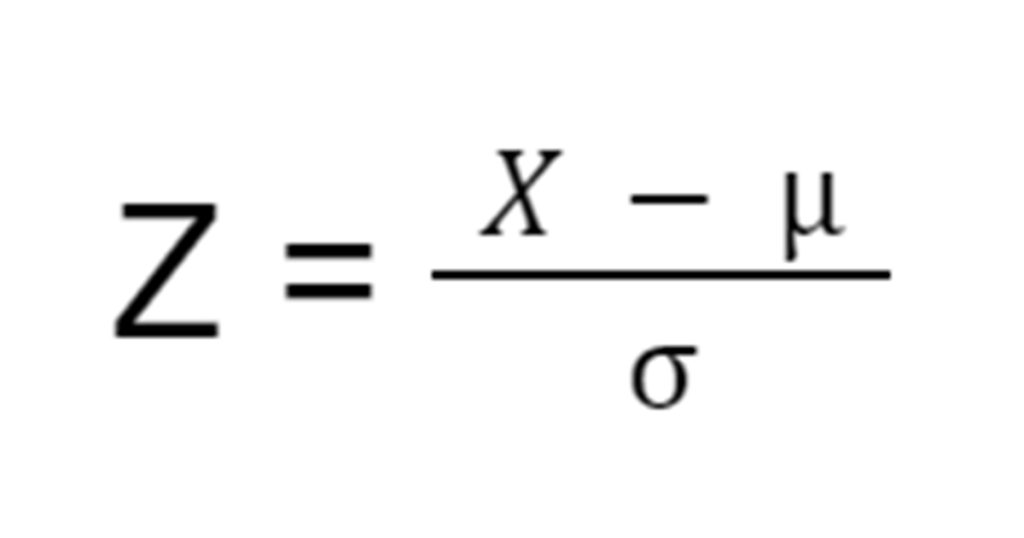
The formula to calculate the Z score is pretty simple. All you have to do is subtract your data point from the mean and then divide the subtracted value by the standard deviation value. Mathematically, the formula for the Z score is written as follows:
Assuming,
Z = Z score
X = Data point
µ = Mean
σ = Standard Deviation
Calculate Z Score in Excel
Although there isn’t a function to calculate the Z score in Excel, there are functions to calculate the mean and the standard deviation of a range. This should speed up the entire process of calculating the Z score.
Step 1: Calculate the Mean Value
The mean value refers to the sum of all values divided by the number of all values. For example, if I have 3 apples that are 5cm, 6cm, and 7cm in diameter each, the mean diameter will be (5+6+7)/3 which is equal to 6cm. In Excel, the AVERAGE function calculates the mean value of a range.
The AVERAGE function is written in the following format in a formula:
=AVERAGE(number1, [number2],...)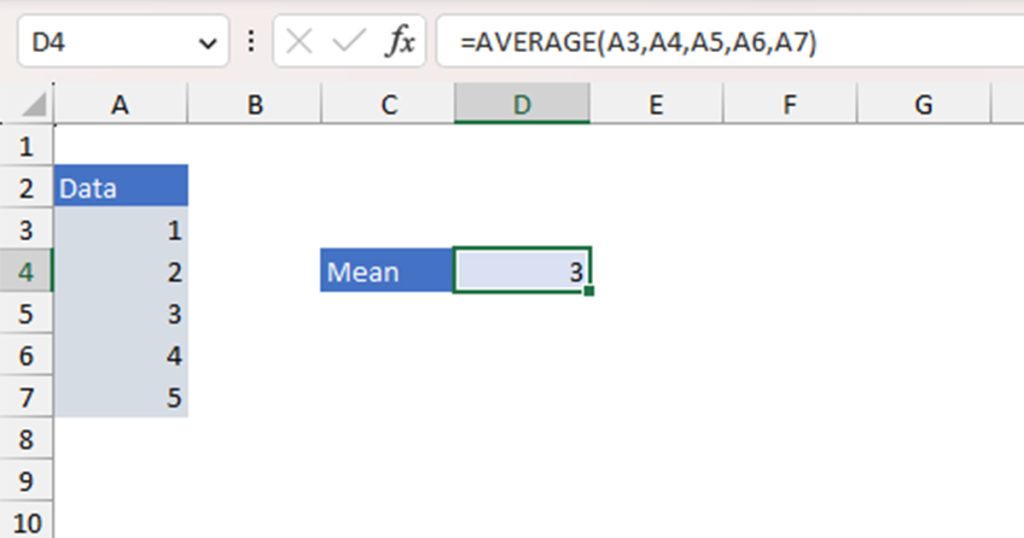
The first number is required in the function while the total number of numbers your add after the first input is optional.
Step 2: Calculate the Standard Deviation
After you’re done calculating the mean value, your next step will be to quantify the standard deviation of the data range. Standard deviation calculates how dispersed the data set is in reference to the mean value.
Similar to calculating the mean value, there are the STDEV.P and STDEV.S functions responsible for calculating the population and sample standard deviation respectively. You will, however, typically use population standard deviation (STDEV.P) when calculating the Z score.
The STDEV.P function in the following format to construct a formula in Excel:
=STDEV.P(number1, [number2],...)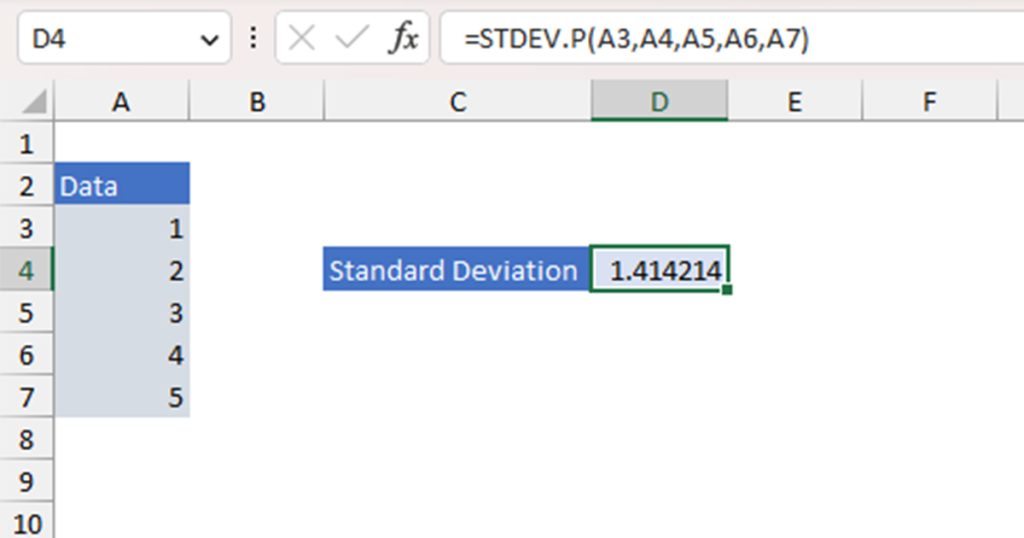
You must enter the first argument for the formula to work. After that, you may add as many numbers as you require.
Step 3: Calculate the Z Score
Finally, you can use the mean and the standard deviation value to calculate the Z score value. Let’s assume that cell D3 has the mean value, and D4 has the standard deviation value. Your data set is in the range A3:A7. You wish to calculate the Z score of the data in cell A6.
Your formula to calculate the Z score will look something like this:
=(A6-D3)/D4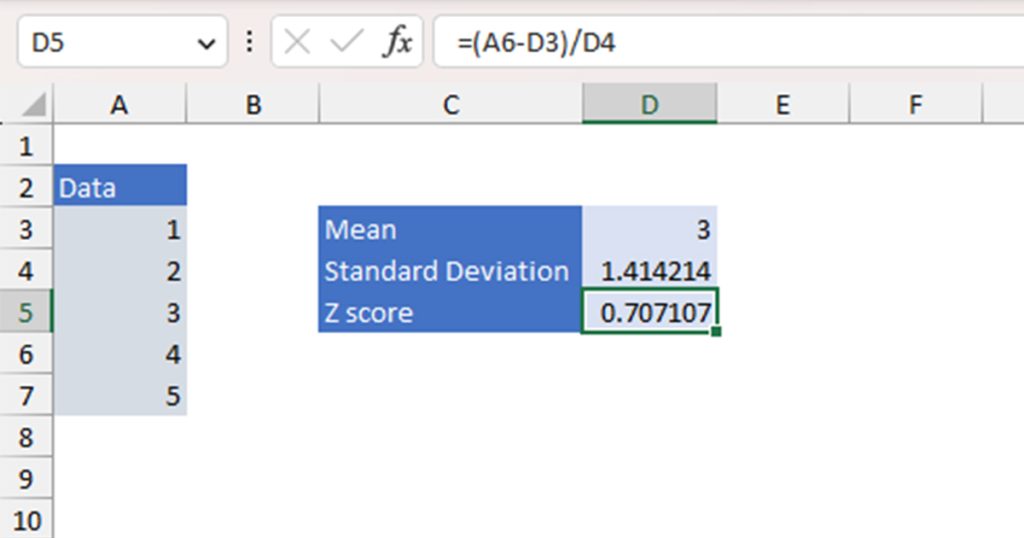
Example: Calculating the Z Score of Heights of NewBorns
For this example, we will be calculating the Z score of heights in ages 0-1.
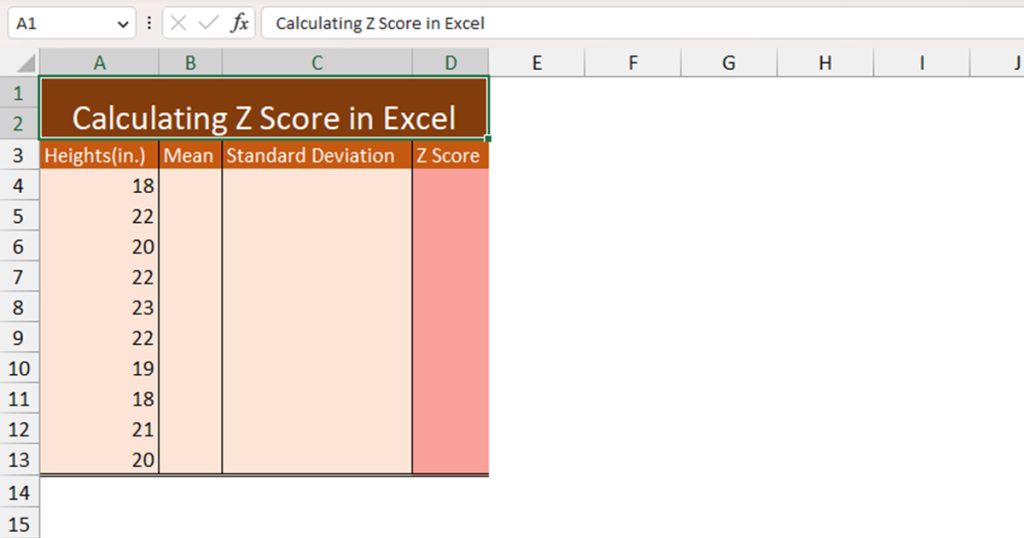
Here is our data range in column A. We have Column B, Column C, and Column D for mean, standard deviation, and Z score respectively. As these are singular values, we have merged cells from row 4 to row 13 in each of these columns.
Step 1: Calculating the Mean
First, let’s calculate the Mean value using the AVERAGE function. Here is the formula we used to obtain our mean value:
=AVERAGE(A4:A13)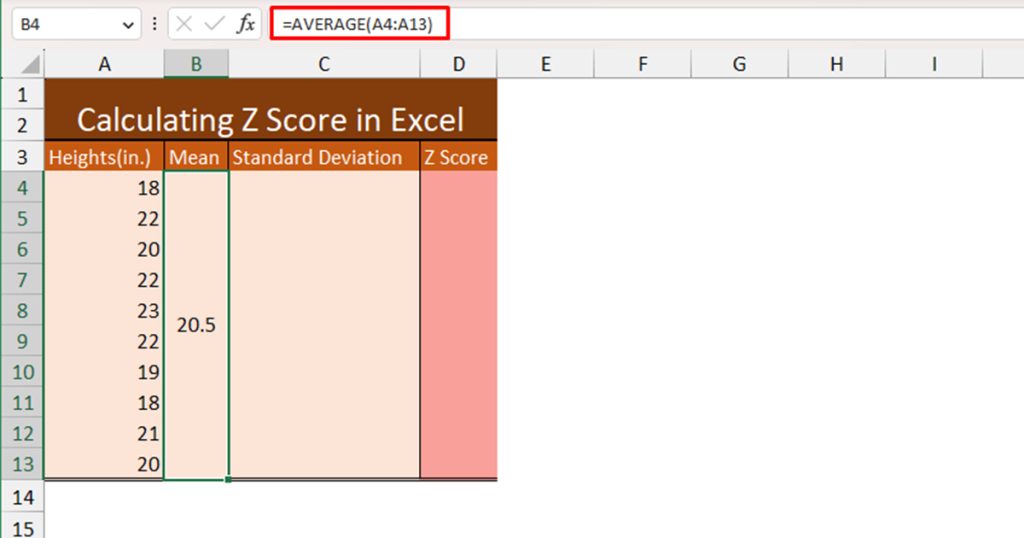
This resulted in 20.5.
Step 2: Calculating the Standard Deviation
Now, we will be using the Standard Deviation using the STDEV.P function. This is the formula we used to calculate the population standard deviation of our data range:
=STDEV.P(A4:A13)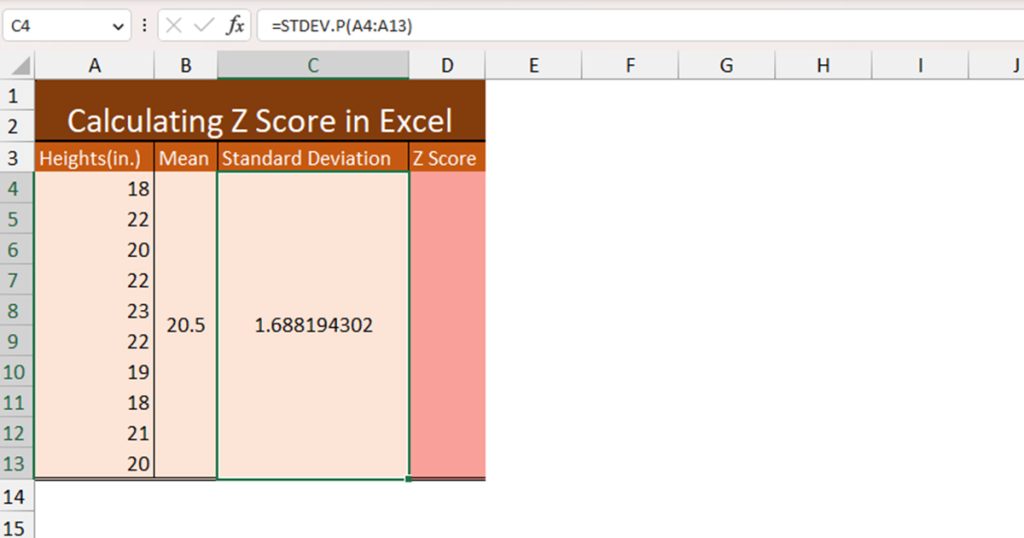
Our result is approximately 1.6881.
Step 3: Calculating the Z Score
After we’ve calculated both our mean and standard deviation values, we can move ahead and calculate the Z score of a data point in column A. For this example, let’s calculate the Z score of cell A10, 19.
Here’s the formula we will be using to calculate the Z score of cell A10.
=(A10-B4)/C4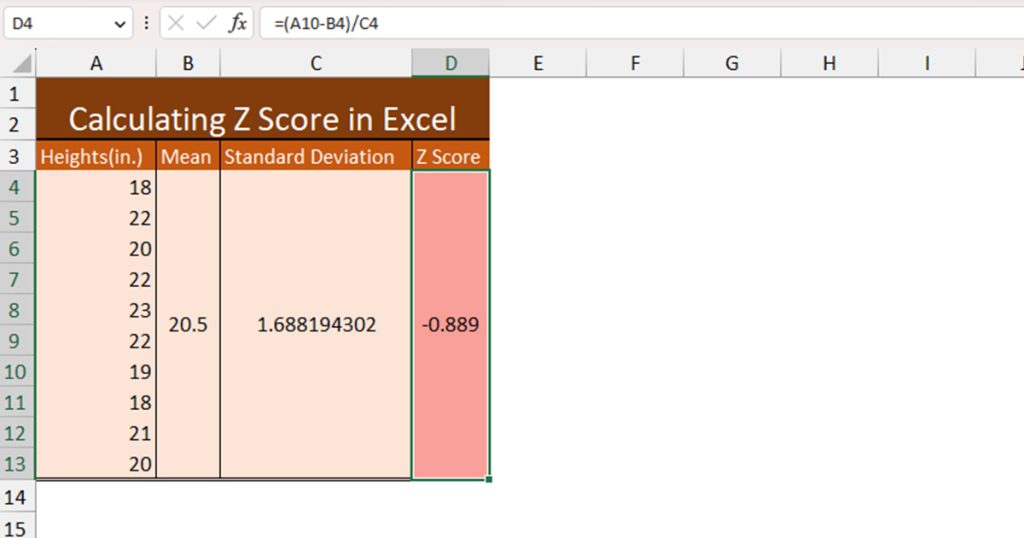
The value, 19cm is -0.889 S.D away from the mean value. As our result is negative, it indicates that it is less than the mean value.