When you have raw statistical data in Excel, it is difficult for researchers to analyze the information and draw conclusions. The only way to transform such raw data into a meaningful one is to create a cross-tabulation.
If you’re unfamiliar with the term “Cross-Tabulation,” let’s deep dive into its meaning first.
Cross Tabulation – Overview
Cross-tabulation or Cross Tabs is one of the commonly used analysis tools by researchers to compare the variables – especially for Quantitative analysis. Basically, it’s a table with a summary of data divided into subgroups.
In addition to Market Research, Cross tabs can be found in sectors such as HR departments, Schools, Customer Support teams, and so on.
A customer service team, for example, could use it to analyze survey data on customer satisfaction levels and make improvements based on the findings.
How to Create Cross-tabulation in Excel
We will be using the Excel’s Pivot Table to create cross tabs. You can even refresh the table to update the changes according to the source data.
Example: Here I have a data collection of Gender and Occupation Status in my Excel Sheet. I’ve extracted this data from the Survey form. But, in order to prepare a Quantitative Research Report, I need them in the Cross-Tabulation format.
- Firstly, select the entire data on your Sheet.
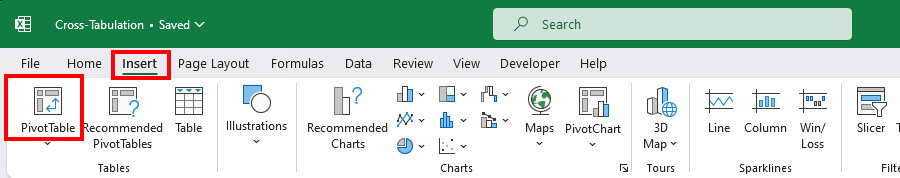
- In the Insert Tab, click on PivotTable.
- On the PivotTable window, below Choose where you want the PivotTable to be placed, pick your preferred location. Here, as an example, I chose New Worksheet.
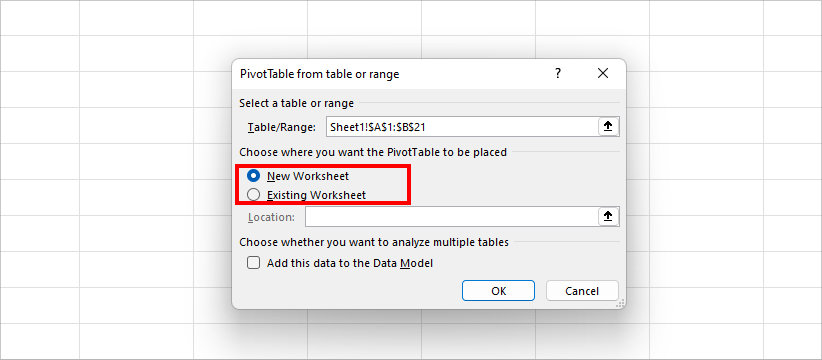
- New Worksheet: Excel will create a Pivot Table in another new sheet.
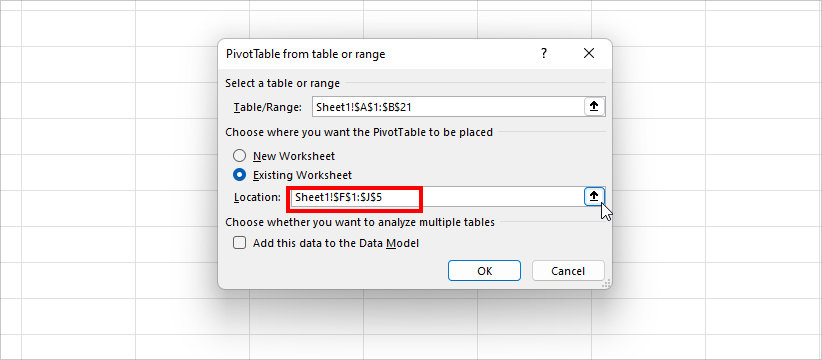
- Existing Worksheet: You’ll have the Pivot Table within the same sheet but in a different area. If you pick this, click the Collapse icon on Location and select a Cell range.
- Click OK to confirm.
- Now, head to the PivotTable Fields and tick mark on both variables. Here, we have Gender and Occupation Status.
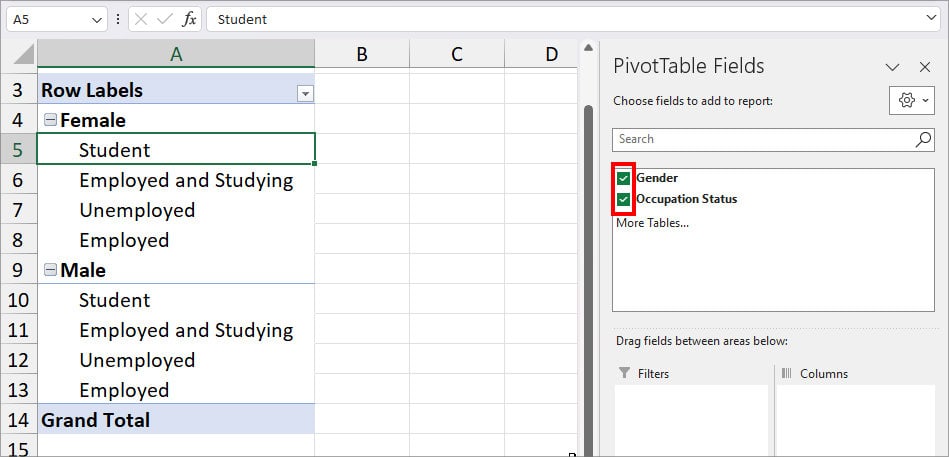
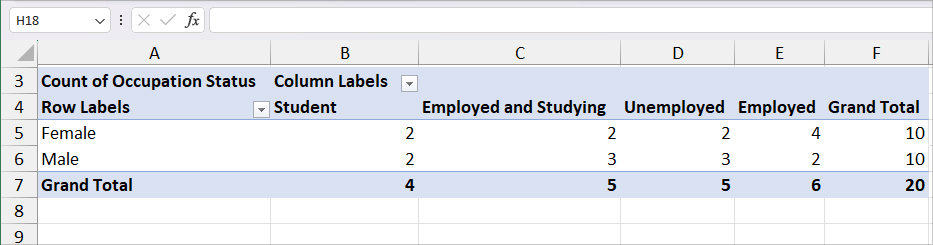
- If you see the Row field, two variables are already there. Leave the First variable in the Row. Just, drag and drop the second variable into the Columns field and Values field.
- Your PivotTable should now look something like this.
In case, you have 0 value in the source data, the PivotTable will have a blank empty cell. To add 0, right-click on the PivotTable and pick PivotTable Options. On the PivotTable Options, head to the Layout & Format. Checkmark the box on For empty cells show and enter 0. Then, click OK.