A pie chart is a graphical representation used to display the percentage composition of any given set of data.
Incorporating Pie charts in PowerPoint presentations not only improves the data representation but also enhances overall visual appeal. They are useful for illustrating the relationship between the data, especially when comparing survey results or tracking financial progress.
PowerPoint has a built-in feature that allows users to choose from a variety of styles for creating a Pie chart.
Here, I will provide a step-by-step guide on how you can create a Pie chart in PowerPoint and customize it to your preference.
Step 1: Get Your Data Ready
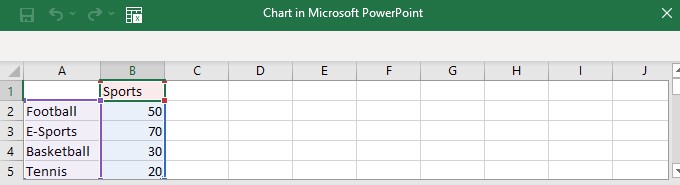
Firstly, create your chart data in a Spreadsheet. Later, we will copy this data while preparing the Pie chart.
Before preparing your data, make sure there are no blank cells in your data range and avoid too many categories, as it will make your pie chart look clustered.
Here, I will be creating a pie chart based on the data of various students involved in different sports at school.
Step 2: Choose Your Pie Chart Style in PowerPoint
PowerPoint offers various styles of Pie charts, such as:
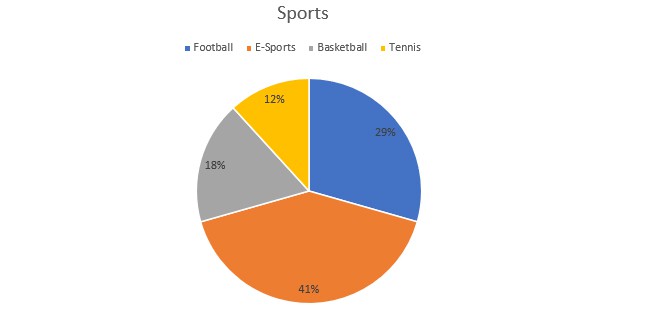
- Pie Chart: This is a basic 2-D chart style offered by PowerPoint.
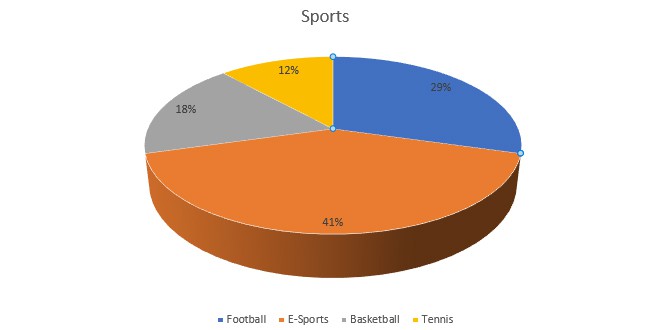
- 3-D Pie Chart: Just like the name suggests, this style adds a 3-D effect to your Pie chart.
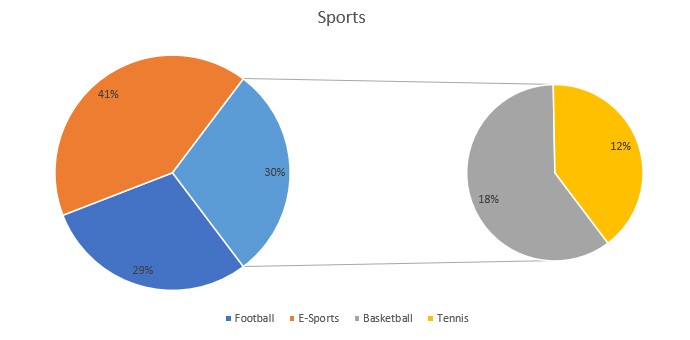
- Pie of Pie/Bar of Pie Chart: Such Pie charts contain two charts, one of which represents the slice of the main pie chart.
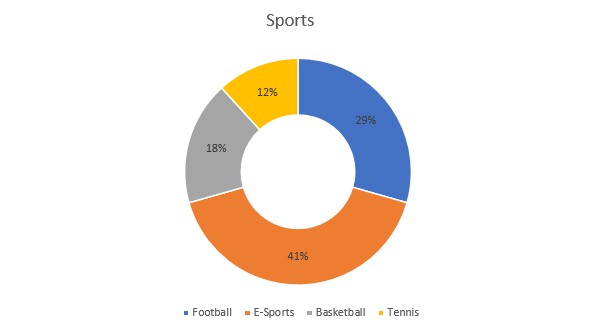
- Doughnut Chart: This type of Pie chart is shaped like a doughnut and has a hole in the middle.
For this demonstration, we will be using a 3-D style Pie chart.
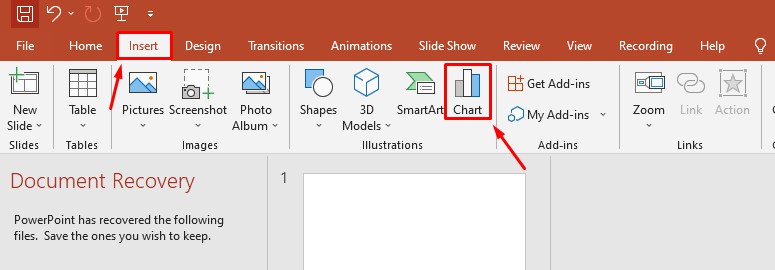
- Open PowerPoint.
- Go to the Insert Ribbon and click on Chart.
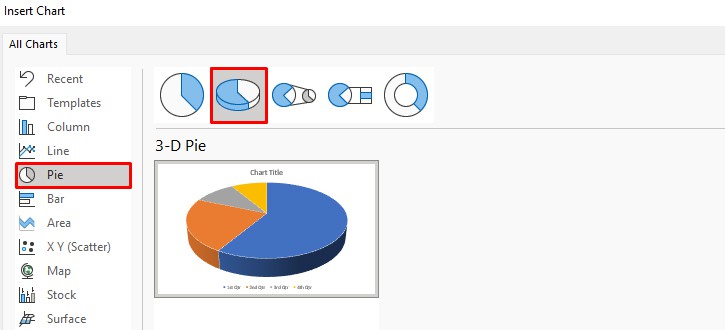
- Click on Pie, select 3-D Style chart design, and click OK. (You can choose any style on the basis of your preference.)
- You will be prompted to an Excel Sheet pop-up where you can paste the data from Step 1. When done, close the spreadsheet to save your changes.
Step 3: Editing Data and Chart Style/Type
If you need to make a few changes to your data and chart styles or types, PowerPoint allows you to do so easily.
Editing Data
You can also change/modify the data that you had initially input in the pie chart.
First, click on the Pie chart and select Chart Design from the ribbon. Then, double-click on Edit Data under the Data section. Now, make the necessary changes to the spreadsheet data.
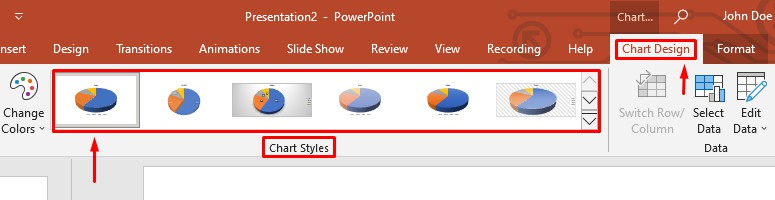
Change Chart Style
The Chart style provides a total of ten different themes by default that you can choose from to represent your Pie chart. This option is available right beside the Change Colors option.
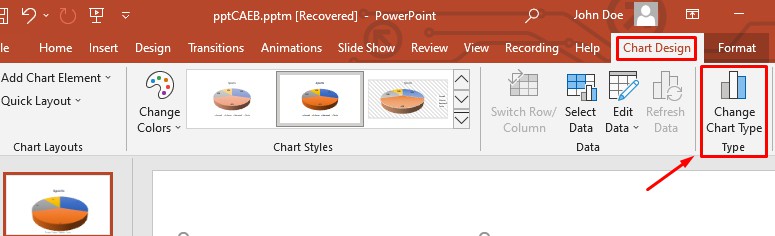
Change Chart Type
If you ever feel like changing your chart style at any point in creating your PowerPoint slide, you can change it through the Change Chart Type option at the top right section under the Chart Design ribbon.
Step 4: Editing Your Pie Chart Appearance
PowerPoint offers various designs you can choose from to make your Pie chart more informative and visually appealing.
Layout
The layout option allows you to modify the appearance of the Pie chart. You can choose to represent your data in percentage using this option.
To edit the layout, go to Chart Design and click on Quick Layout, which will open a drop-down menu. You can select your preferred layout from these options.
Chart Element
The Chart Element option in chart design will allow you to change how you want the elements of the chart to appear. Additionally, you can also format text effects for the chart.
To edit the chart element, click on the Add Chart Element on the left side panel of the Chart Design ribbon.
Change Color
You can choose your preferred color style from various color palettes provided in PowerPoint. If you would like to keep your chart simple, you also have the option to select monochrome colors.
Click on Change Colors from the Chart Design ribbon to select the color pattern of your chart.
Scale and Move
To change the size of your Pie chart, simply click on your chart from the slide. Now, drag it from the edges to scale it according to your desired size.
Similarly, you can drag and drop the chart to move it once you have clicked on the chart.